Kiribatii-Onotoa fish resource assessment survey

1 Pages 1-10

▲back to top

1.1 Page 1

▲back to top
t1
~~p
Government of Kiribati
Onotoa
Fish Resource Assessment Survey
Using the Underwater Visual Census Technique
Compiled by Taratau Kirata
May 2000
Fisheries Division
Ministry ofNatural Resource Development

1.2 Page 2

▲back to top
Acknowledgment:
I would like to give many thanks to the people involved in the survey, in particular the
dive team: Tuake Teema, Toaea Beiateuea, Teboko Tarau, Tekeea Tebaobao and Atata
Okitawa. Tebaua Onorio and Tarai Baura from the Marine Resource Assessment Unit
who did most ofthe data input.
Onotoa Fisheries Assistant Aram Keati's help in arranging transport, a skiff for
conducting dives in the lagoon.
The Ag. Chief Fisheries Officer Johnny Kirata in providing a fruitful briefing before the
survey team left.
Background Information:
Onotoa has a population of 1918 in the 1995 census. It is located in the southern
Kiribati group at Latitudes 10 47'S to 10 57'S and Longitudes 1750 31' E to 1750 38'
E. The island has a land area of 15.62 sq. Kms, reef area of21.56-sq. Kms and lagoon
area o£15.38 sq. Kms. It has a Fishing Household in 1999 of402 houses with annual
catch in 1998 of385.50 kg.
Onotoa is one of the four islands namely Butaritari, Nonouti and TabNorth that the Live
Reef Trade Fish export took place. The fishing activity only concentrated on two
villages Buariki and Temao. This is because the fish cages were located near these
villages. The fishermen had difficulty in transporting their catch by using their small
canoes from villages that were extreme in distance from the fish cages. Ifthey had
motorboats, it would be easier, similar to what is provided by China Star the company
that operated on Butaritari, transporting offish would be easier.
1

1.3 Page 3

▲back to top
1. Introduction:
On Friday the 26 May 2000, a team of three personnel from the Marine Resource
Assessment and Monitoring Unit and two from the Engineering Unit visited Onotoa on
the RS Tebenebene; the team spent ten days on the island. This team conducted an
Underwater Visual Census (lNC) survey on the island's reef The team was also
despatched to determine the distribution, trend and abundance ofgroupers on the coastal
reef ofOnotoa. This would help determine the impact of commercial fishing on
populations ofgroupers, wrasses and emperors on the island. However, since the Live
Reef Trade fishing activity stopped operating in February 1999 this survey could be
treated as a resource assessment of the forenamed finfish species.
Coral reefs are amazing living creatures with ecosystems that support a diverse marine
life. The ecosystem has great importance to the subsistence and artisanal fisheries of
Kiribati. In recognition of this, coral reefs have to be well managed not only for its
present role but also for its further roles. Appropriate coral reef management plans
should be devised and made sure that the strategies are put into practise. The main
objectives ofthese management plans are to conserve reef resources. These resources
are susceptible to extinction or drop to dangerous numbers and would not be
sustainable. It is believed that humans increase exponentially where as this is not the
case with coral reef resources. Much ofthese living resources are not enduring as was
once said, but instead decline in numbers as we interfere or disrupt their habitats
because of our own advantage. Recent studies on groupers in the Indian, Caribbean and
Palau results shows that they are prone to over-exploitation by extensive fishing
activities, in particular if caught or targeted during their spawning aggregation runs.
This is also the case in Kiribati (Awira 1999).
2. Materials and methods:
The method used in this survey was out lined in the manual: Manual for assessing Fish
Stocks on Pacific Coral Reefs. Edited by Melita Samoilys (ACIAR).
The fish species and their scientific names were cross referenced by using photographs
in the book: A practical guide to the identification ofthe coral reefs fishes ofthe tropical
central pacific and western pacific.
The survey included an infonnal interview with local fishennen, to collect relevant
infonnation on the potential sites for the trade where these fish species would be
abundant. The spawning seasons, spawning aggregating grounds, fishing seasons and
fishing activities were questions asked. As for ciguatera fish poisoning, because it is a
drawback to the industry it was carefully made sure that they do point out the sites that
were believed to be toxic
There were six stations with four replicates, two deep and two shallow dives in every
station: in total 24 transects. The sites selected at each station were the ones that would
give the most representative of the whole coral reef of the island. Five stations were
located on the outer reef of the island's barrier reef, the sixth located in the lagoon area
of the atoll so a general comparison could be made with the outer reef There was also a
control site located on the reef south ofI8!.-flIDlra.ug!lilaReef This site is referred to as
the control site (Station 3) because fishers do not frequently visit it. The handling
\\'6 D~)~;_ :1:. ~~., C.«-- "{/ ,) 'It l /-i'
2

1.4 Page 4

▲back to top
fishing methods for reef fishes is not commonly practised within this area because it has
been known to harbour dangerous shark's ie. Great white shark, Tiger shark, and Mako
shark. If fishing trips were conducted around the area, it is usually trolling for oceanic
or pelagic fishes. The trips that are made have to take place early in the morning until
just before mid day. This is because locally it is believed that these dangerous sharks
are asleep early in the morning until midday when they become awake and start the
day's hunting. This was observed to have some truth as Tiger shark, Mako shark and
Grey reef shark were observed sleeping during the survey at one of our site. The
observation of Tiger shark (Galeocerdo cUI-vier) etc. shark sleeping is contrary with
outdated scientific literature.II It says sharks other than the Nurse shark (Nebrius
concolor) do not sleep in a motionless manner or else they will suffocate (Johnson Seeto
pers comm.) Johnson, 1978, supports this recent discovery. During the survey at this
site, it was observed that sharks are also asleep just the way the other finfish do. The
sharks are asleep lying on sandy bottorn, which were at depths of about 30 metres. /i
J/.'
2.1 Fish count and length estimation.
Fish (target species) within the Sm on both sides of the SOm transect were counted. If
the species are high in a particular area, the length is averaged for all ofthese fish
species. When encountering individual fishes the length is estimated. The dives had a
deep and shallow dive so a wider depth range is covered.
Fig. 2.1 Grouper from the family Serranidae (Dati) commonly found on corals reefs of
Kiribati.
An example of how easy it is not to be aware of the presence of this grouper as it
camouflages with the coral reef As already mentioned, this plus other factors
contributes to underestimating the resource.
3

1.5 Page 5

▲back to top
3. Survey Stations:
,,I
+I _.
I,
ONOTOA
1~ 54' S
1·5~ S
-w.,
~,
rt:o:.·
I
Map of Onotoa permission from Lands Office.
4

1.6 Page 6

▲back to top
4. Ciguatera Survey:
Algae were collected using SCUBA driving at sites where fish counting were carried
out. This algae species have been believed to be the most likely settling medium in the
Gilberts' Group: McCarthy and Tebano (1983) of the toxic dinoflagellate:
Gambierdiscus toxicus, Prorocentrum lima, Prorocentrum concave, Ostreopsis
lentircularis and Ostreopsis siamensis. Yasumato et al (1977). These algae include
green algae Halimeda spp. and filamentous red algae species as being evident with
ciguatera outbreak cases on other infected outer islands ie Kuria: Kirata, (1999). The
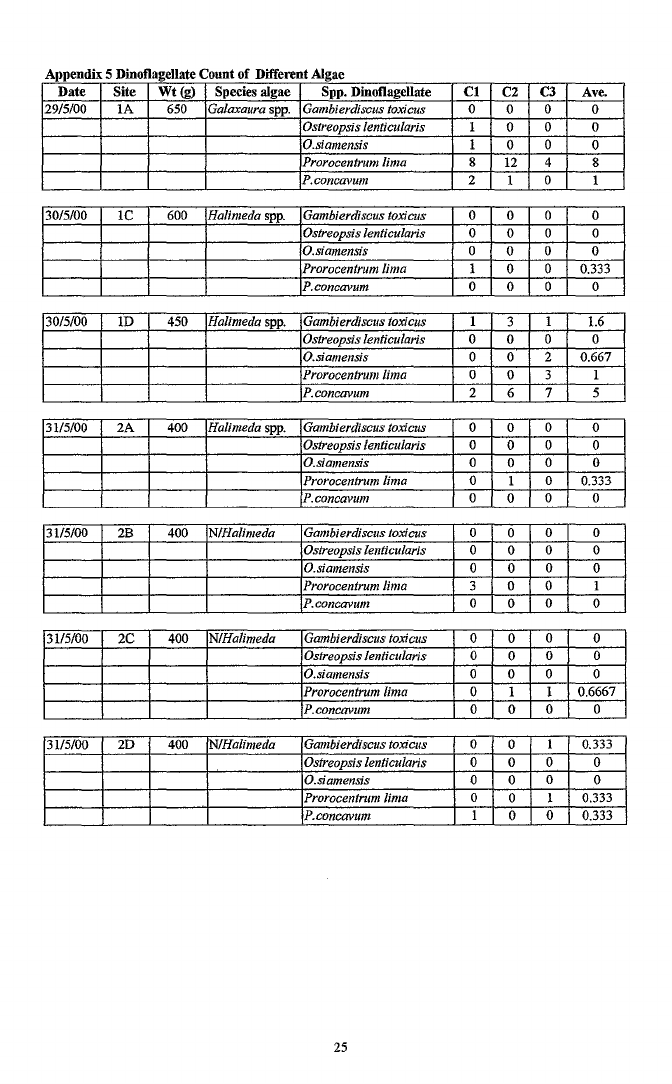
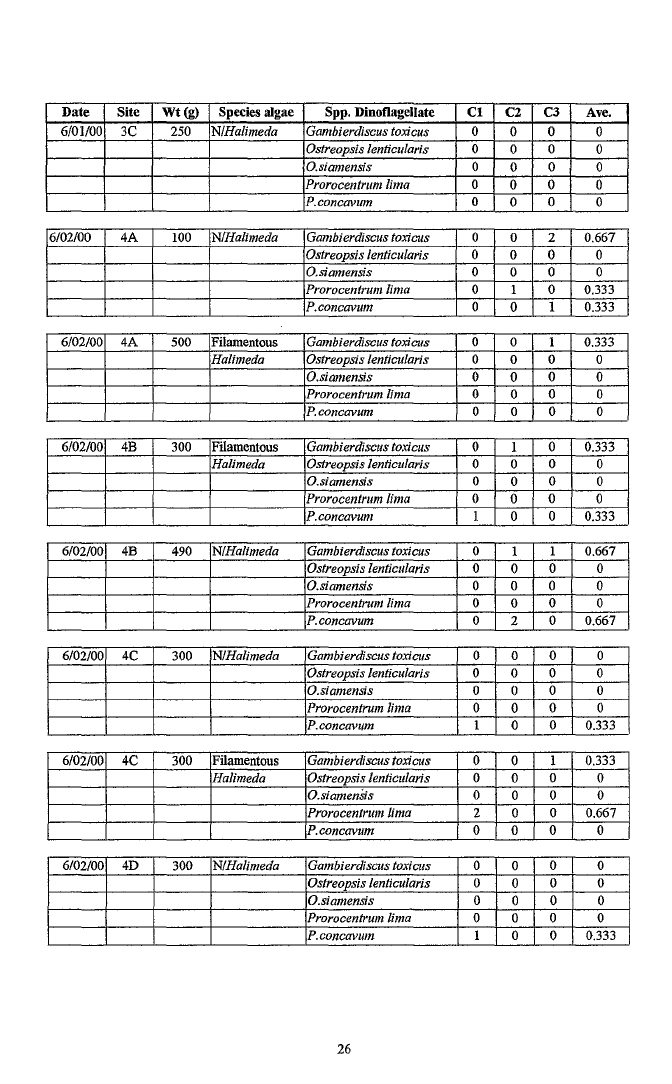
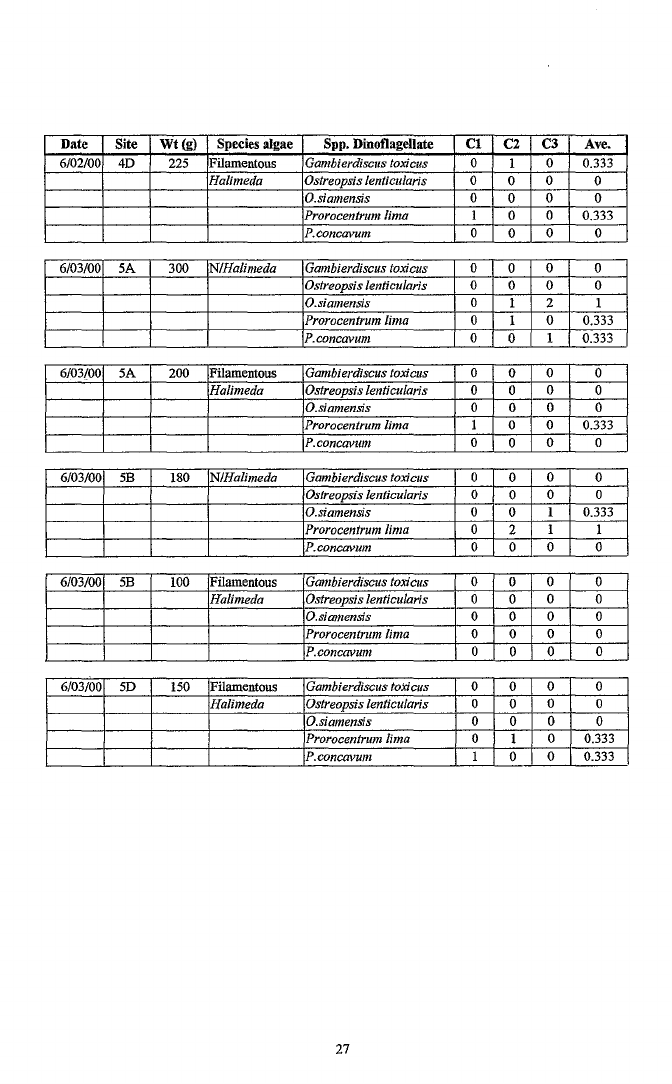
results are presented in Appendix 5.
4.1 Ciguatera interview:
From the interviews, the fishers were consistent with the fact that they have not heard
about ciguatera for a very long time, maybe nearly ten years now. It was true that it was
common in the 1980s but it slowly got better, one or two cases in a year until it got all
right. Aram Keati the islands FA mentioned that during his 5 years working there he
has never had any reported case of ciguatera. Halimeda results from previously toxic
areas, around site 1 collected during the survey, supported this report on ciguatera. It
revealed that very few toxic dinoflagellates believed to cause ciguatera on other islands
were present.
5. Results:
In this survey, the target species were quite a few; this is a bargain between the number
of species to be counted during the survey and the accuracy of the estimated biomass.
This is important as a much more diverse species is being surveyed and so more
information is available for the island's fishery resource. Although the results are not
extra accurate in comparison with fewer species say ten or slightly more the information
is satisfactory for management strategies. It is most applicable where the cost of
conducting such surveys is very expensive.
5

1.7 Page 7

▲back to top
Total number of fish counted in the survey
500 - , - - - - - - - - - - - - - - - - - - - - - -
450 + - - - - - - - - - - - - -
J: 400
~ 350 + - - - - - - - - - - - - - -
'5 300 + - - - - - - - - - - - - - -
li; 250 + - - - - - - - - - - - - - - -
.Ec
:::l
200 +------------~
150 +--------------
Z 100 +---
50 +---
o
Species
13 Aetha/operca rogaa
[J Aptian virescens
II C. min/ata
• Chelinus undu/alus
E. fac/atus
-E. meffa
DElagtis bipinnulalus
!]I LUfjanus bohsr
Ii L. kasmira
[J Lethrinus minialus
Ii P. pleurostigma
• Variola louti
-Anyperodon leucogramicus o Aphareus rutilans
• CephaJopho/is argus
mC. leopardus
[J C. ufodeta
Caranx me/ampygus
DE. corallicola
-E. hexagonatus
iii E. cynopodus
-E. roaeu/alus
liE. polyphekadion
o Gracila albomarginata
DE. tauvina
I3 Gymnosarda un/c%r
mLutjanus gibbus
ElL. fulvus
iiiL. monostigma
[J L. ramak
8 Lefhrinus obseletus
EJ P. Isevis
CParupeneus barberinodes PJectropomus aree/alus
Fig. 5.1 Graph showing number of species and count number.
The graph shows that the highest numbers oftarget species over 50 are Luijanus gibbus,
Luijanus bohar, Cephalopholis argus, Lutjanus kasmira and Cephalopholis urodeta.
Luijanus gibbus had the highest; nevertheless, the fish are juveniles found abundant at
site 6 as seen from the survey data.
6

1.8 Page 8

▲back to top
Densityof all species counted in the UVC
.
survey
......oooE
50.0 , - - - - - - - - - - - - - - - - - - - -
40.0 + - - - - - - - - - - - - -
Gl
...Q. 30.0 + - - - - - - - - - - - - -
CIl
..Q
E 20.0 + - - - - - - - - - - - -
:c::l
~ 10.0 +----
"cii:i
Gl
C
0.0
EI Aetha/operca rogaa
[J Aprion virescens
.C. miniata
Ii Chelinus undulatus
E. faeiatus
8E. msrra
[J Elagtis bipinnuJatus
iii Lutjanus bohar
-L. kasmira
D Lethrinus miniatus
ED P. pleurostigma
• Variola louff
• Anyperodon leucogramicus IJ Aphareus ruti/ans
• Cephalopholis argus
lSI C. leopardus
tJ C. urodefa
Caranx melampygus
[J E. corallicoJa
II E. cynopodus
E. hexagonatus
II E. maeu/aius
II E. polyphekadion
D GracJ1a afbomarginata
mLutjanus gibbus
mL. monostigma
mLethrinus obse/efus
[J E. tauvina
mGymnosarda unicolor
C L tulvus
[J L. ramak
EI P. laevis
EJ Parupeneus barberinodes Plectropomus areolatus
5.1 Stock Estimation:
It is always a good assumption when overestimating densities; are more accurate as
there would be always a portion likely to be missed by divers. Overestimating can be
detected or otherwise measured for its accurateness. The stock estimation that were
able to be calculated in this report used the weight length relationship available from
Melita et al 95 figures from the Fiji-Papua New Guinea survey. This is because the
database for length-weight relationship for Kiribati is not yet available. So the
estimated stock could be either overestimated or underestimated. However, from local
experience tlli.sc01!lclbe underestimated as reef fish in this part ofthe pacific region
seemly,grow at fast rateS) an area where it could further be researched.
- . "
~_., ,-
--
7

1.9 Page 9

▲back to top
Estimated Stock of some reef fish assessed
1600
1400
- 1200
111
Ql
l:
l:
1000
-0
I-
.5 800
-.x
(,) 600
0
l/)
400
200
0
Fig. 5.2 Graph showing estimated stock of some species counted on during the uve
survey.
Mean Species Table
Site
number
1
2
3
4
5
6
Average no. of
shallow soecies
10
10
6
9
8
5
Average no. of
deeD sDecies
12
11
14
10
9
5
Average site
soecies
11
10
10
10
8
5
Table: 5.1 Table showing mean species at surveyed stations
8

1.10 Page 10

▲back to top
The table shows that the highest species diversity is at site one. However, site 3 had the
highest with its deep species offourteen. This is because site 3 was the site, which was
not commonly visited by fishermen, and if visited it is for a limited fishing time
(morning til mid-day). Site 6 is located in the lagoon and has the lowest number of our
target species. The list ofthe target species is listed in Appendix 1. The deep dives
conducted at each site had most ofthe target species. This gives us the general picture
that the target species were mostly abundant at slightly greater depths 20-27 metres. In
comparing, the outer reef with the lagoon area there were also noticeable difference.
Results show that there was much higher species diversity on the outer reefthan the
lagoon area. However, there were higher numbers ofjuvenile Lutjanus bohar as to the
outer reef area. The nursery area therefore is located at lagoon habitats.
5.3 Mean Densities of Surveyed Species:
Mean Density Table of sites
Site
number
1
2
3
4
5
6
Mean density no/lOOOm' for all species
counted
36
45
28
56
38
86
Table: 5.2 Table showing mean densities for each site surveyed.
9

2 Pages 11-20

▲back to top

2.1 Page 11

▲back to top
Mean density of all species counted at each
site
100
90
N~ 80
E
c:> 70
...0
0
60
-(;
C 50
.i:' 40
'iii
c 30
'"C 20
10
0
,.
/
/
~
/
---- .....
/
/ ...........
•/ ...........
2
3
4
5
6
Site
[--Average density [
As can be seen from the graph, site 6 has the highest mean density of the six sites
surveyed. This site was located in the lagoon. For the biomass, it is different.
6. Discussion:
. The general view of the Onotoa survey is a little different from the other uve surveys
that have been conducted on the other islands. This is because the survey observed a
more diverse serranidae family group on the outer reef slope. Slightly higher abundance
of Chelirms undulatus (humphead wrasse) and grouper species Plectropomus areolatus
and Cephalopholis argus were found. This could be inferred from good fisheries
management to their reef resource. A good example here is Tamana and Arorae, the
southern most tips of the southern group where fishing are not done on Sundays and
certain types of fishing methods and equipment are not permitted. Although this may
not be commonly and strictly practised nowadays it is good management ie.
Mechanised motorboats not used in any fishery. Another reason may be owing to
biased data collection compared to the other surveys. However, errors due to biased
data collection were minimised by having the same counters throughout the whole of
the six stations surveyed. The counters were also the same ones who conducted similar
surveys on the other islands. Therefore, it would be accurate to neglect this assumption.
The Live Reef Trade Fish that began trading these finfish species ceased operation not
that it had no more of these grouper species. As it seems by the survey the resource; the
numbers were decreasing and so they voluntarily decrease their fishing pressure.
Maybe the local people were worried, as it had become apparent to them that the
numbers were diminishing dramatically. An accurate or reliable estimate of the
maximum sustainable yield of the resource has to be worked out if the fishery has to be
properly managed. It is not possible to obtain such information from the available data,
however it is most probable to be much less than the estimated biomass.
10

2.2 Page 12

▲back to top
The salinity of Onotoa Island is quite consistent throughout the outer reef at the sites
that were surveyed. It falls between 35 °/00 and 35.5 °/00. The lagoon area was slightly
higher 36 °/00. This is usual considering the fact that it is relatively small in size 75.38
sq. lan. These salinity measures are normal thought, when compared with the open sea
salinity of37 "/00. Enclosed area for example could fluctuate around this open sea
salinity depending on the amount of precipitation within that region.
6.1 Lagoon area:
Lagoon areas have a coral reef patchy characteristic with many areas having sandy
seabeds, but does not harbour the target species. These areas are known not to be good
places for all species of the family Serranidae, in particular the Labridae which are not
found there and are one ofthe highly priced fish species in this fish trade. Fish count
results from this area confirms the assumption. The survey was extensively carried out
on the reef area, it is believed to have a diverse Serranidae species and high abundance -
thus proved from other previous surveys (Awira, 1999). Results that were conducted on
the lagoon area shows that it was true however red snappers (Lutjanus gibbus) juveniles
were present in high numbers. This suggests that the site could be the rearing place for
this species.
7. Conclusion:
4'
Although from the survey it is quite clear that the island's reef resource is not in a
dangerous situation, it can not be taken for granted the stiII abundant ofthese reef
resources are of no problem. One can say that we Pacific Islanders are fortunate for
these given marine resources that are being sought at very high prices from many
countries, in these instance the Chinese people and that we should make us of it. We
should also bear in mind our role as the individual owners ofthese resources to properly
manage and conserve them not only for economic benefits but also for our future
generations. Hear it could be concluded that more work is to be done in order to be sure
ofthe dynamic standing ofthese reef fish. However, this survey presents itself an
overall view that the kind ofoperation that took place there could be beneficial to both
the locals and the country from foreign earings getting into the country. This is because
there are no indisputable damages to the marine resource or the marine environment in
general. As already mentioned it could only be possible if proper management plans are
put in place and the locals are well aware ofthem. Onotoa has the potential ofthe Live
Reef Fish Trade returning. This is because ciguatera survey conducted on the island it
reveals that the dinoflagellates proved to be responsible for ciguatera are present but not
exceedingly abundant, plus the additional fact that there are no reported cases of fish
poisoning there. This was the principal reason for the withdrawal ofthe companies
(China Star Enterprises and Marine Product Kiribati) which ventured this business here
in Kiribati.
11

2.3 Page 13

▲back to top
Recommendations:
The survey forms a preliminary baseline for coral reef fish (studied here are the most
important local species). Although the survey is preliminary, it is very important as it
acts as a snapshot view of Onotoa's marine resource assessment. It has been
recommended previously from similar surveys like this, that a Marine Protected Area is
most relevant to be set-up in areas where these groupers aggregate. Here it is also very
much supported and hoped that it is enacted in the very near future, as the longer the
delay is the seriousness the problem becomes.
The duration of the last commercial fishing activity to the time of the survey is over one
year. After this survey, it could be concluded that ifthere were an impact to these
resources, the effect might have recovered. It is recommended that if the Live Reef Fish
Trade were to be operative again, it would be good management if operative for I year
and ceased the next year and start again the following year. The years where it is closed
the operators could move to an island where it was closed the previous year. This then
could be operational all throughout the year and each year taking alternate years within
islands. Although it has been proved that fish stocks would not completely recover after
one year, at least it will lessen the fishing pressure as seen during the survey.
While it is common practise by the locals to only go out fishing early in the morning
until midday, is likewise good management strategy. This is because fish are harvested
at specified periods ie. Morning to midday and so they are landed in restricted
quantities. This should be encouraged, but for a different perspective. These sharks
have a very good purpose for them to be present ecologically in their natural habitat;
and be achieved by not harvesting it unrestrainable ie. For the shark fin trade. This is a
multimillion-dollar industry, however it is considered unsustainable at this stage.
It is recommended that since the Live Reef Fish industry is new it is appropriate that it
is monitored carefully. Since the industry has ceased operating now, this would be
practicable in future, as the industry would return if proper arrangements were made and
their current suppliers elsewhere are depleted. Careful monitoring of these coral reef
fish resources would help prevent the resources from being depleted at an early stage, as
the resources are vulnerable to overexploitation. Beside that, the local population is
dependent on for their subsistence fishery.
12

2.4 Page 14

▲back to top
References:
Awira, R. (1999). The Impact of Commercial Fishing on Serranids and Labrids
fisheries on the islands ofButaritari, Nonouti and Tabiteuea North based on the
Underwater Visual Census Survey and Proposals for the established of Marine
Reserves. Fisheries Division, Ministry ofNatural Development, Tarawa.
Birkeland, C. (1997). Symbiosis, Fisheries and economic development on coral reefs.
TREE vol. 12, no.9, September 1997.
Johnson, R. H. (1978). Sharks of the tropical and temperate seas. Les editions du
Pacifique. 10, Avenue Bruat Papeete Tahiti.
Kirata, T. (1999). Kuria Island fish poisoning. Fisheries Division, Ministry ofNatural
Resource Development, Tarawa.
Myers, R. F. (1991). Micronesian Fishes. A practical guide to the identification ofthe
coral reef fishes of the tropical central and western pacific.
Coral Graphics, Guam. USA.
Samoilys, M. (1997). Manual for Assessing Fish Stocks on Pacific Coral Reefs.
Department ofPrimary Industries, Queensland Training Series QE97009. Brisbane,
Australia.
Underwood, A. T. (1981). Techniques of analysis of variance in experimental marine
biology and ecology. Oceanogr. Mar. BioI. Ann. Rev. 19: 513 - 605
Yeeting, B. M (1999). Live Reef Fish developments in Fiji. SPC Fisheries Newsletter.
SPC Noumea New Caledonia.
Yasumoto, T. , Nakajima, I. , Bagnis, R. , and Adachi, R. (1977). Finding of a
dinoflagellate as a likely culprit of ciguatera. Bull. Jpn. Soc. Sci. Fish. 43: pp. 1021-
1026
13

2.5 Page 15

▲back to top
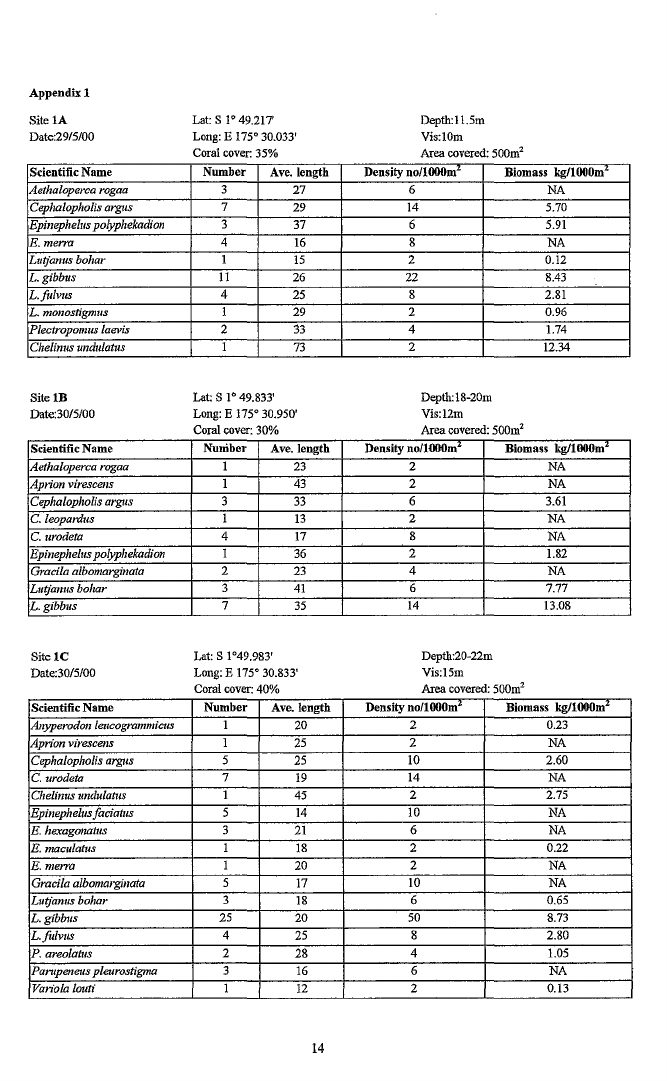
Appendix!
Site !A
Date:29/5/00
Scientific Name
Aethaloperca rogaa
Cephalopholis argus
Epinephell/s po/yphekadion
E. merra
Lutjanus bohar
L. gibbus
L.jl/lvl/s
L. mOllostigmus
Plectropomus [aevis
Chelinus undulatus
Lat: S 10 49.217'
Long: E 1750 30.033'
Coral cover: 35%
Number Ave. length
3
27
7
29
3
37
4
16
I
15
II
26
4
25
I
29
2
33
I
73
Depth:ll.5m
Vis:lOm
Area covered: 500m'
Density no/HMlOm"
Biomass kgllOOOm"
6
NA
14
5.70
6
5.91
8
NA
2
0.12
22
8.43
8
2.81
2
0.96
4
1.74
2
12.34
Site 1B
Date:30/5/00
Scientific Name
Aethaloperca rogaa
Aplion virescens
Cephalopholis argl/s
C. leopardl/s
C. urodeta
Epinephelus polyphekadion.
Gracila albomarginata
Lutjanus bahar
L. gibbl/s
Lat: S 10 49.833'
Long: E 1750 30.950'
Coral cover 30%
Nuniber Ave. length
I
23
I
43
3
33
I
13
4
17
I
36
2
23
3
41
7
35
Depth:18-20m
Vis:12m
Area covered: 500m'
Density no/1000m"
Biomass kg/1000m"
2
NA
2
NA
6
3.61
2
NA
8
NA
2
1.82
4
NA
6
7.77
14
13.08
Site 1e
Date:30/5/00
Scientific Name
Anyperodon leucogrammicus
Apn"on virescens
Cephalopholis argl/s
C. urodefa
Chelinus undulatus
Epinephell/s faciauis
E. he;tagonatus
E. maculatus
E. merra
Graci/a albomarginata
Lutjanus bohor
L. gibbl/s
L.jl/lvl/s
P. areolatus
Pantpeneus pleurostigma
Variola [oub"
Lat: S 1049.983'
Long: E 1750 30.833'
Coral cover: 40%
Number Ave. length
I
20
I
25
5
25
7
19
I
45
5
14
3
21
I
18
I
20
5
17
3
18
25
20
4
25
2
28
3
16
I
12
Depth:20-22m
Vis:l5m
Area covered: 500m2
Density no/1000m'
Biomass kg/1000m'
2
0.23
2
NA
10
2.60
14
NA
2
2.75
10
NA
6
NA
2
0.22
2
NA
10
NA
6
0.65
50
8.73
8
2.80
4
1.05
6
NA
2
0.13
14

2.6 Page 16

▲back to top
Site 1D
Date:30/6/00
Scientific Name
Aethaloperca rogaa
Caranx melamygus
Cepha!opholis argus
C. urodeta
Epinephelus fasciatus
Gracila albomarginata
Lutjamls -bahar
Pompeneus barberinoides
Plectropomus laevis
Lat S 10 49.017'
Long:E 175 0 30.779'
Coral cover: 40%
Number Ave. length
2
23
2
36
6
18
7
12
I
14
I
25
3
14
2
14
I
27
Depth:
Vis: 15m
Area covered: 500m2
Density no/HlOOm'
Biomass kgllOOOm'
4
NA
4
NA
12
1.16
14
NA
2
NA
2
NA
6
0.30
4
NA
2
0.47
Site2A
Date:3I/5/00
Scientific Name
Aethaloperca rogaa
Aprian virescens
Cepha!opholis argus
C. urodeta
Epinephelus hexagonatus
E.menu
Gracila albomarginata
Lutjanus bahar
L. jil!VU'
L. kasmira
L. ramak
Paropenells barbenonodes
LatS 10 51.412'
Long:E 1750 30.911'
Coral cover: 80%
Number Ave. length
11
22
I
45
10
29
2
17
2
17
I
13
I
27
8
20
I
28
18
15
1
18
22
22
Depth:23m
Vis:20m
Area covered: 500m2
Density no/1OOOm"
Biomass kgllOOOm"
22
NA
2
NA
20
8.14
4
NA
4
NA
2
NA
2
NA
16
2.37
2
0.98
36
4.55
2
0.20
44
NA
Site2B
Date:3115100
Scientific Name
VI. rogaa
Chepha!opholis argus
Caranx melampygus
Chelinus lIndulatus
L. bohar
L. gibbus
L. kasmira
L. monostigmus
Plectropomus area/atlls
Lat S 10 51.595
Long: E 1750 30.834'
Coral cover: 75%
Nnmber Ave. length
1
18
8
33
I
30
3
45
30
48
5
25
3
14
4
27
1
80
Depth:25m
Vis:20m
Area covered: 500m2
Density no/1OOOm'
Biomass kg/1OOOm'
2
NA
16
9.63
2
NA
3
4.13
60
124.98
10
3.41
6
0.36
8
3.14
2
13.30
15

2.7 Page 17

▲back to top
Site2C
Date:31/5100
Scientific Name
Anyperodon leucogrammiclIs
C. arglls
C. melampygus
C. urodeta
E. hexagonatlls
E.menu
L. bohar
Lethrinus miniatus
La!: S 1° 51.865
Long: E 175° 30.828'
Coral cover: 75%
Number Ave. length
I
21
4
19
2
23
I
18
I
17
2
15
2
25
I
52
Depth: 8m
Vis: 20m
Area covered: 500m'
Density no/lOOOm"
Biomass kg/lOOOm"
2
0.34
8
0.91
2
NA
2
NA
2
NA
4
NA
4
1.16
2
5.84
Site2D
Date:3 1/5100
Scientific Name
A. leucogrammictls
A. togaa
C. argus
C. Wldlllatlls
C. IIrodefa
E. hexagonahls
E.menu
Lethrinus ramak
L: gibblls
P. barberinoides
La!: S I· 52.023'
Long:E 175· 30.802'
Coral cover: 40%
Number Ave. length
I
33
3
22
3
30
I
42
3
12
I
22
2
18
II
23
4
32
2
27
Depth:9m
Vis:20m
Area covered: 500m2
Density nollOOOm'
Biomass kg/lOOOm'
2
1.34
6
NA
6
2.71
2
2.22
6
NA
I
NA
4
NA
22
4.72
8
5.71
4
NA
Site3A
Date: 1/6/00
Scientific Name
Anyperodon leucogrammiClis
Aethaloperca rogaa
Cephalopholis argllS
C. melampyglls
C. undlllanls
C. IIrodefa
E. corallicoJa
E. hexagonatus
E. miniatus
E. polyphekadion
Gracila albomarginata
L: bohar
L. gibblls
L. kasmira
L. ramak
P. barberinoides
La!: S 1·52.549'
Long:E 175° 30.377'
Coral cover: 50%
Number Ave. length
5
29
2
22
I
26
I
26
3
41
4
16
I
29
2
27
3
17
I
50
2
19
5
22
3
33
9
15
2
27
I
18
Depth:25m
Vis:23m
Areacovered:500m'
Density no/lOOOm"
Biomass kg/lOOOm"
10
4.55
4
NA
2
0.59
2
NA
6
6.19
8
NA
2
NA
4
NA
6
NA
2
4.75
4
NA
10
1.98
6
4.70
18
1.33
4
lAO
2
NA
16

2.8 Page 18

▲back to top
Site3B
Date: 1/6/00
Scientific Name
Aethaloperca ragoa
Apiron virescens
Caranx melampygus
Cephalopholis lIrodefa
Epinephelus corallicola
E. cynopodlls
E. hexagonatus
E. miniatlls
E. poiyphekodioll
Gynmosarda unicolor
Plectropomus area/otus
Variola louti
Site3C
Date:1/6/00
Scientific Name
A. ragoa
A. virescens
Cephalopholis arglls
Chelinus undulatus
C. urodeta
Epinephelus miniatus
Gracila albomarginata
L.utjanus bohar
Lethrinus miniatus
V.louti
Sea. Calm
Site 3D
Date: 1/6/00
Scientific Name
c.argus
C. urodeta
Site 4A
Date:2/6/00
Scientific Name
Aprion virescens
C. argns
E. cynopodlls
E. poIyphekadiOIl
G. albomarginata
L.fllivus
L. gibblls
Lat: S 1° 53.067'
Long:E 175° 30.215'
Coral cover: 10 • 20"10
Number Ave. length
3
29
I
22
I
27
2
14
I
20
2
32
3
31
2
23
I
25
2
27
I
62
I
38
Depth: 22 . 35m
Vis:25m
Area covered: 500m2
Density nollOOOm·
Biomass kg/lOOOm·
6
NA
2
NA
2
NA
4
NA
2
NA
4
NA
6
NA
4
NA
2
0.63
4
NA
2
6.07
2
4.25
Lat: S 1° 53.243'
Long: E 175° 30.405'
Coral cover: 30%
Number Ave. length
2
31
2
26
6
26
4
67
2
11
2
22
2
17
3
20
I
21
2
26
Depth:11 -12.5m
Vis:25m
Arreacovered:SOOrn2
Density no/lOOOm'
. Biomass kg/lOOOm'
4
NA
4
NA
12
3.51
8
37.82
4
NA
4
NA
4
NA
6
0.89
2
0.41
4
2.69
Lat: S 1° 53.316'
Long:E 175° 30.656'
Coral cover: 40%
Number Ave. length
10
40
11
14
Depth:7m
Vis:25m
Area covered: 500m2
Density nollOOOm'
Biomass kg/lOOOm'
20
21.52
22
NA
Lat: S 1° 57. 350'
Long: E 175° 33. 923'
Coral cover: 20%
Nnmber Ave. length
I
40
2
33
1
36
2
53
I
31
3
20
22
21
Depth:22m
Vis:25m
Area covered: 500m2
Density no/lOOOm'
2
Biomass kgIlOOOm'
NA
4
2.41
2
NA
4
11.27
2
NA
6
1.09
44
8.90
..
17

2.9 Page 19

▲back to top
cont. for site 4A
1. kasmira
L monostignms
L. ramak
P. barberinodes
P. laevis
Site4B
Date: 2/6/00
Scientific Name
C. argus
C. urodeta
E. hexagonatus
E. polyphekadion
G. albomarginata
L.fa/vus
L. kasmira
P. laevis
Site:4C
Date:2/6/00
Scientific Name
A. rogaa
C. argus
C. urodeta
E. merra
L. bohar
L.fulvus
L. gibbus
L. ramak
Site:4D
Date:2/6/00
Scientific Name
~. rogaa
Apharells mtilans
C. argus
C. urodeta
G. albomarginata
L·fil/vuS
L. gibbus
L. kasmira
L. ramak
P. barberinoides
4
19
8
1.19
4
26
8
2.82
20
15
40
2.34
1
22
2
NA
3
41
6
5.10
Lat S 10 57. 083'
Long: E 1750 33. 905'
Coral cover 40%
Number Ave. length
1
24
1
14
1
18
4
46
3
21
6
20
29
15
7
40
Depth:18m
Vis: 25m
Area covered: 500m2
Density no/lOOOm'
Biomass kgflOOOm'
2
0.46
2
NA
2
NA
8
14.90
6
NA
12
2.19
58
4.44
14
11.03
Lat: S 10 56. 744'
Long: E 1750 33.894'
Coral cover: 20%
Number Ave. length
1
30
3
24
3
16
5
17
4
17
6
18
15
26
1
20
Depth:11 • 12m
Vis: 25m
Area covered: 500m2
Density no/lOOOm'
Biomass kgflOOOm'
2
NA
6
1.38
6
NA
10
NA
8
0.73
12
1.60
30
10.93
2
0.28
Lat: S jO 56.427'
Long: E 1750 33.767'
Coral cover: 30%
Number Ave. length
2
32
1
35
2
33
4
33
1
35
2
21
49
22
6
14
3
18
5
16
Depth: 15m
Vis: 25m
Area covered: 500m2
Density no/lOOOm'
4
2
Biomass kgflOOOm'
NA
NA
4
2.41
8
NA
2
NA
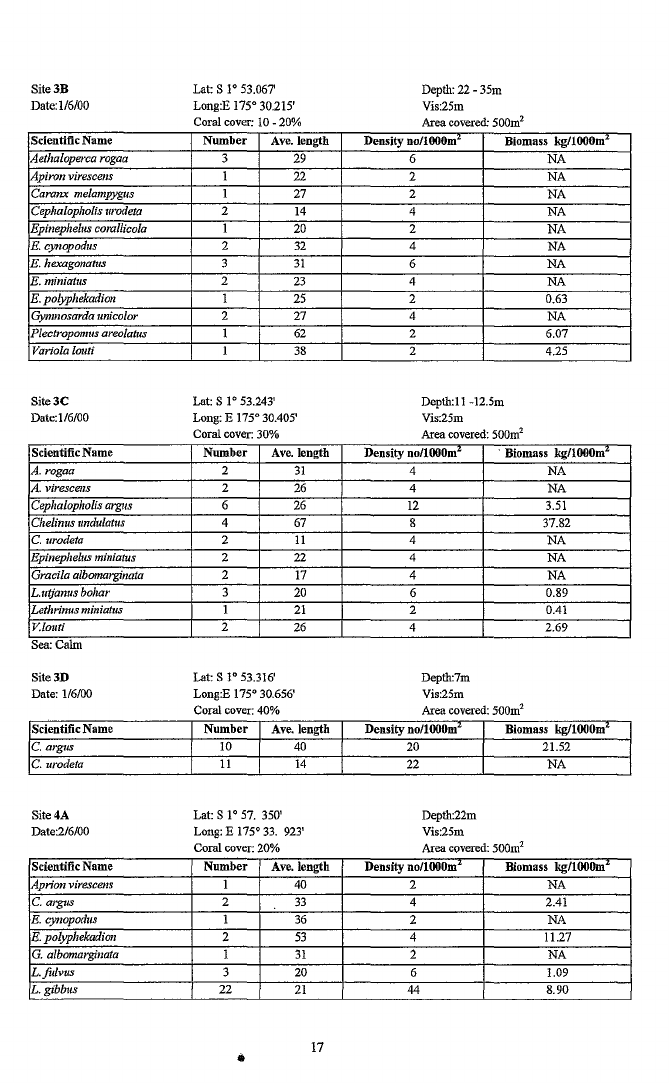
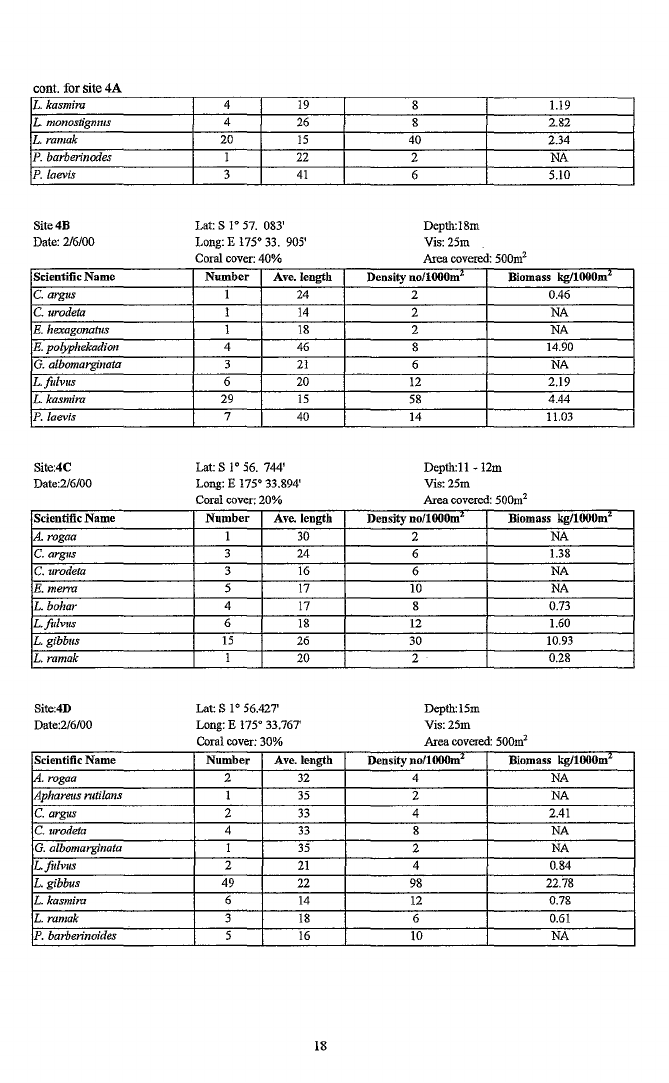
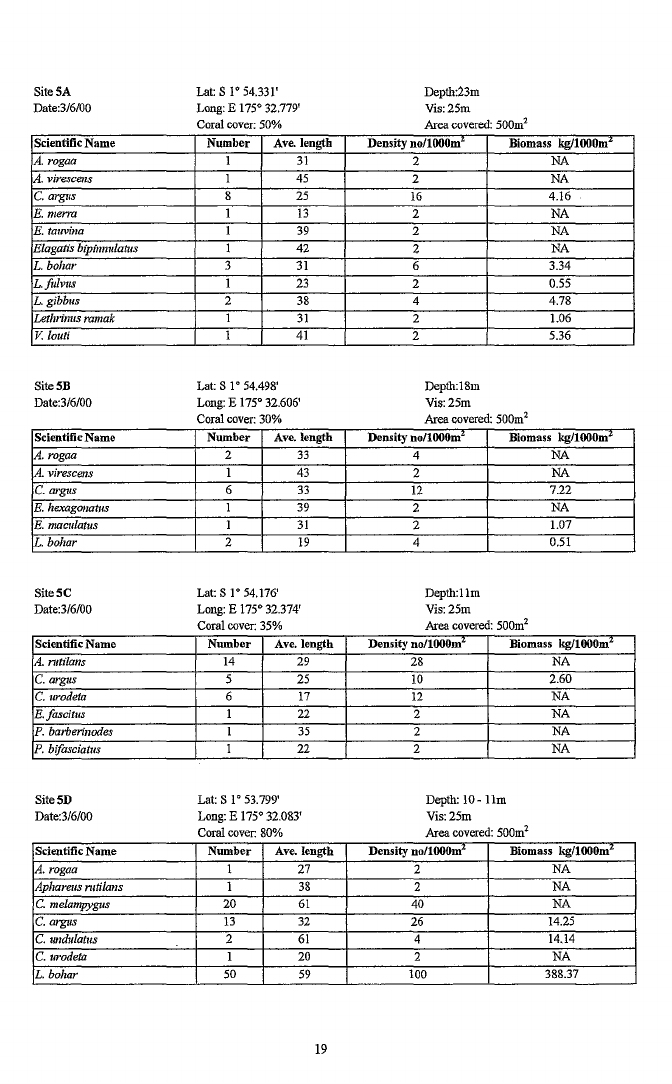
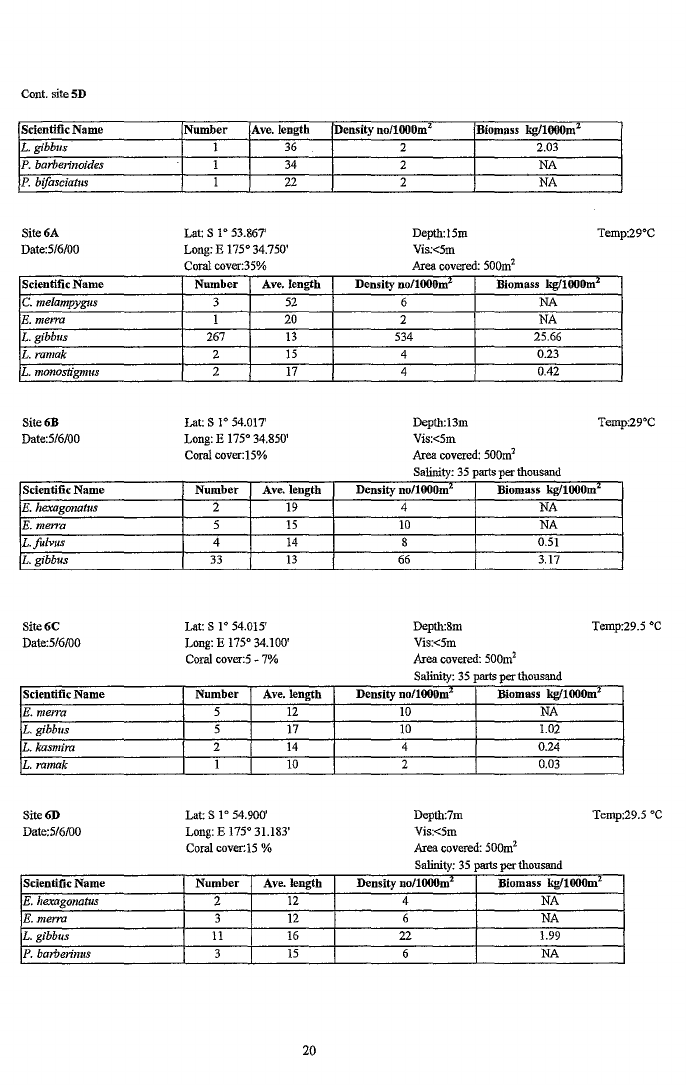
4
0.84
98
22.78
12
0.78
6
0.61
10
NA
18

2.10 Page 20

▲back to top
Site SA
Date:3!6/00
Scientific Name
A. rogaa
A. virescens
C. argus
E. merra
E. tauvina
Elagatis bipinnulatlls
L. bohar
L·fi,lvus
L. gibblls
Lethrinus ramak
V. lOllti
Site SB
Date:3/6!00
Scientific Name
A. rogaa
lAo virescens
C. argus
E. hexagollauls
E. maculatus
L.bohar
Site SC
Date:3/6/00
Scientific Name
A. nttilans
C. argus
C. urodeta
E·fascitus
P. harberinodes
P. bifasciatus
SiteSD
Date:3/6/00
Scientific Name
A. rogaa
Aphareus mtilans
C. melampygus
C. argus
C. undulatus
C. urodeta
L. bohar
Lat: S 10 54.331'
Long: E 1750 32.779'
Coral cover: 50%
Number Ave. length
I
31
I
45
8
25
I
13
I
39
I
42
3
31
I
23
2
38
I
31
I
41
Depth:23m
Vis: 25m
Area covered: 500m2
Density no!HlOOm"
2
2
Biomass kg/l000m"
NA
NA
16
4.16
2
NA
2
NA
2
NA
6
3.34
2
0.55
4
4.78
2
1.06
2
5.36
Lat: S 10 54.498'
Long: E 1750 32.606'
Coral cover: 30%
Number Ave. length
2
33
I
43
6
33
I
39
I
31
2
19
Depth:18m
Vis: 25m
Area covered: 500m2
Density nollOOOm"
4
2
Biomass kg/l000m"
NA
NA
12
7.22
2
NA
2
1.07
4
0.51
Lat: S 10 54.176'
Long: E 1750 32.374'
Coral cover: 35%
Number Ave. length
14
29
5
25
6
17
I
22
I
35
I
22
Depth:llm
Vis: 25m
Areacovered:5001112
Density no/l000m"
Biomass kg/l000m"
28
NA
10
2.60
12
NA
2
NA
2
NA
2
NA
Lat: S 10 53.799'
Long: E 1750 32.083'
Coral cover: 80%
Number Ave-length
I
27
I
38
20
61
13
32
2
61
I
20
50
59
Depth: 10 - 11m
Vis: 25m
Area covered: 500m2
Density no!1000m"
2
2
40
Biomass kg/l000m'
NA
NA
NA
26
14.25
4
14.14
2
NA
100
388.37
19

3 Pages 21-30

▲back to top

3.1 Page 21

▲back to top
Cant. site 5D
Scientific Name
L. gibblls
P. barberinoides
P. bi/asciatus
Site 6A
Date:5f6fOO
Scientific Name
C. melampyglls
E. merra
L. gibblls
L. ramak
L. monosb'gmlls
Site6B
Date:5f6fOO
Scientific Name
E. hexagonatus
E. menu
L.illIvlIs
L. gibblls
Site6C
Date:5f6/00
Scientific Name
E. mefTa
L. gibbus
L. kasmira
L. ramak
Site6D
Date:5f6/00
Scientific Name
E. hexagonatus
E.merra
L. gibbus
P. barberinus
Number
1
1
1
Ave. length
36
34
22
Density nofHMJOm'
2
2
2
Biomass kgflOOOm'
2.03
NA
NA
Lat: S 1° 53.867'
Long: E 175° 34.750'
Coral cover:35%
Number Ave. length
3
52
I
20
267
13
2
15
2
17
Depth: 15m
Temp:29°C
Vis:<5m
Area covered: 500m'
Density noflOOOm"
Biomass kgf1000m"
6
NA
2
NA
534
25.66
4
0.23
4
0.42
Lat: S 1° 54.017'
Long: E 175° 34.850'
Cora! cover:15%
Number
2
5
4
33
Ave. length
19
15
14
13
Depth:13m
Temp:29°C
Vis:<5m
Area covered: 500m2
Salinity: 35 parts per thousand
Density noflOOOm'
Biomass kgflOOOm"
4
NA
10
NA
8
0.51
66
3.17
Lat: S 1· 54.015'
Long: E 175" 34.100'
Coral cover:5 - 7%
Nnmber
5
5
2
1
Ave. length
12
17
14
10
Depth:8m
Terop:29.5 ·C
Vis:<5m
Area covered: 500m2
Salinity: 35 parts per thousand
Density uoflOOOm"
Biomass kgf1000m"
10
NA
10
1.02
4
0.24
2
0.Q3
Lat: S 1° 54.900'
Long: E 175° 31.183'
Coral cover:15 %
Number
2
3
11
3
Ave. length
12
12
16
15
Depth:7m
Temp:29.5 °C
Vis:<5m
Area covered: 500m2
Salinity: 35 parts per thousand
Density noflOOOm"
Biomass kgflOOOm"
4
NA
6
NA
22
1.99
6
NA
20

3.2 Page 22

▲back to top
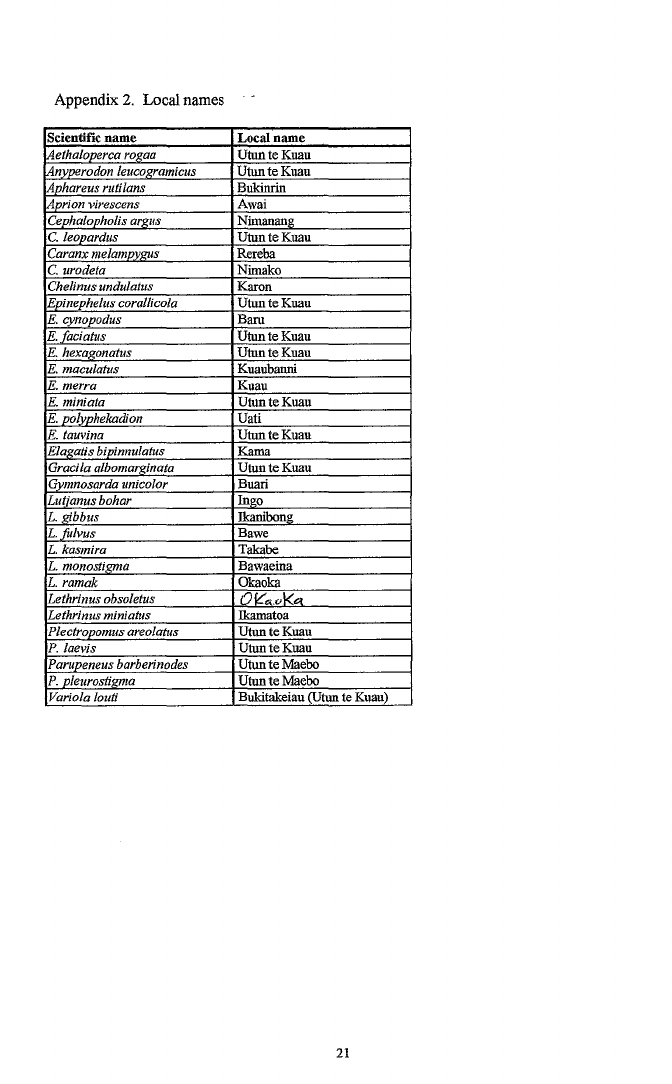
Appendix 2. Local names
Scientific name
lAethaloperca roma
Anyverodon leucof!ramicus
Aphareus rutilans
IAprian virescens
Cephalopholis arf!.US
C. leooardus
Caranx melamoyJ!.Us
C. urodeta
Chelinus undulatus
Epinephelus corallicola
E. cynopodus
E.faciatus
E. hexaf!onatus
E. maculatus
E. merra
E. miniata
E. polyohekadion
E. taUYina
Elaf!atis bioinnulatus
Gracita albomarf!.inata
Gymnosarda unicolor
Lutjanus bohar
L. Jdbbus
L. .fillyus
L. kasmira
L. monostif!JIlO
L. ramak
Lethr/nus obsoletus
Lethrlnus miniatus
Plecfropomus areolatus
P.laeyis
Parupeneus barber/nodes
P. pleurostif!ma
Variola louti
Local name
Utun te Kuau
UtunteKuau
Bukinrin
Awai
Nimanang
UtunteKuau
Rereba
Nimako
Karon
Utun teKuau
Barn
UtunteKuau
UtunteKuau
Kuaubanni
Kuau
UtunteKuau
Uati
UtunteKuau
Kama
UtunteKuau
Buari
Ingo
Ikanihong
Bawe
Takabe
Bawaeina
Okaoka
Ole"" k",
Ikamatoa
UtunteKuau
UtunteKuau
Utun te Maeho
Utun te Maeho
Bukitakeiau (Utun te Kuau)
21

3.3 Page 23

▲back to top
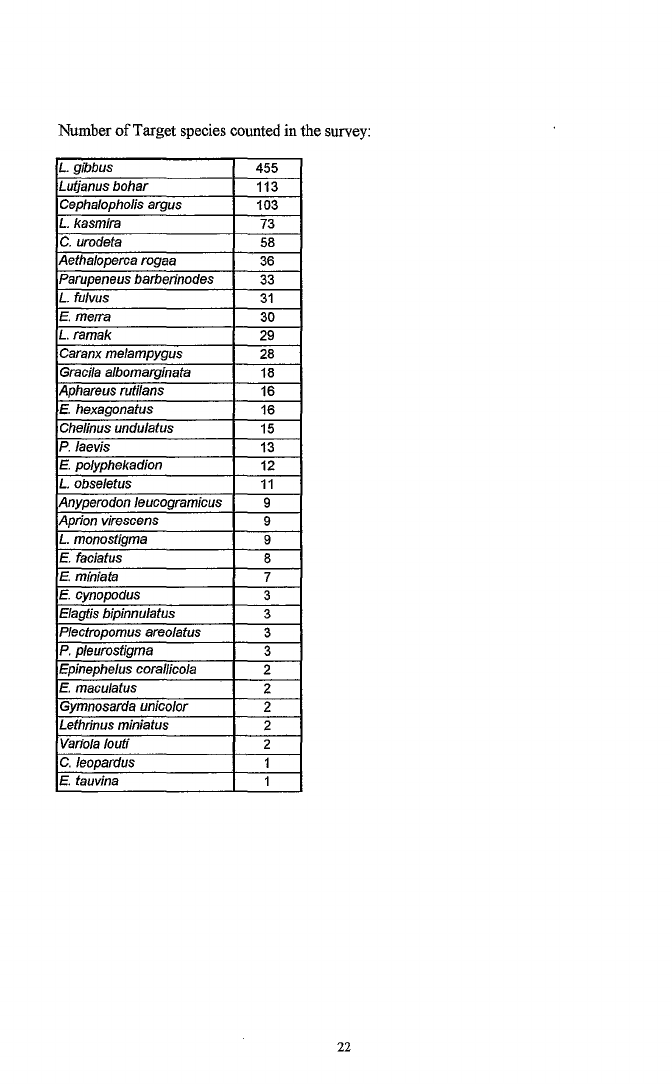
Number of Target species counted in the survey:
L. gibbus
455
Lutjanus bohar
113
CephalophoJis argus
103
L. kasmira
73
C. urodeta
58
Aethaloperca rogaa
36
Parupeneus barberinodes
33
L. fUlvus
31
E. merTa
30
L. ramak
29
Caranx melampygus
28
Graeila albomarginata
18
Aphareus ruti/ans
16
E. hexagonatus
16
CheJinus undulatus
15
P.laevis
13
E. polyphekadion
12
L. obseletus
11
Anyperodon leueogramieus
9
Aprion vireseens
9
L. monostigma
9
E. faeiatus
8
E. miniata
7
E. eynopodus
3
Elagtis bipinnulatus
3
Pleetropomus areolatus
3
P. pleurostigma
3
Epinephelus eora/fieola
2
E. maeulatus
2
Gymnosarda unieolor
2
Lethrinus miniatus
2
Variola louti
2
C. leopardus
1
E. tauvina
1
22

3.4 Page 24

▲back to top
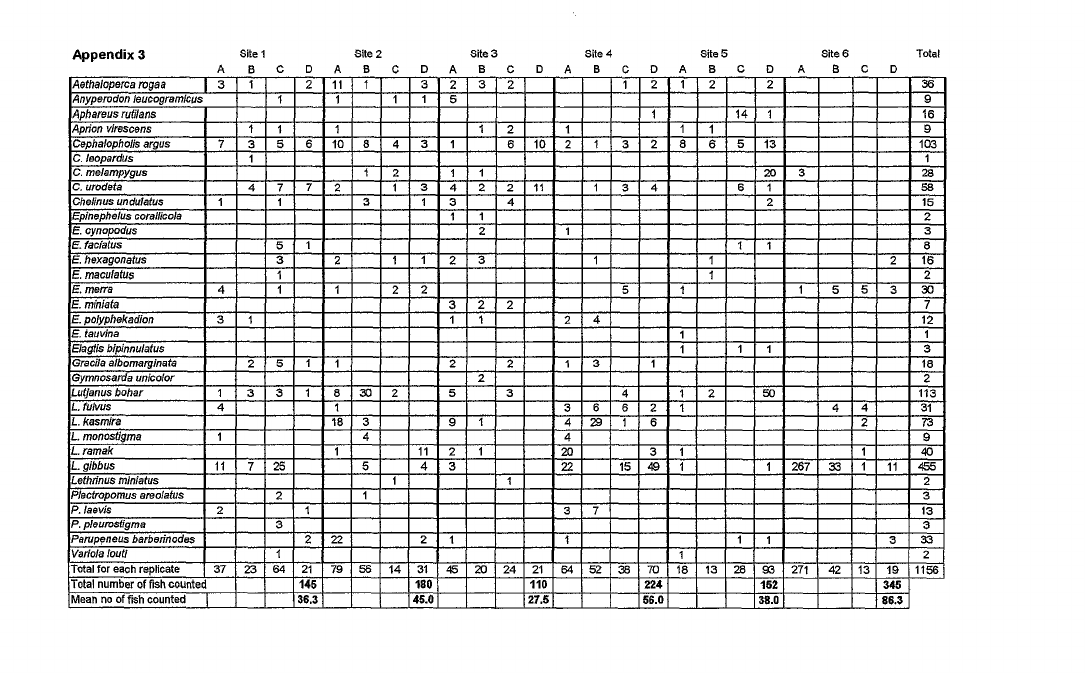
Appendix 3
Site 1
Site 2
Site 3
Site 4
Site 5
Site 6
Total
A 8 C -D A 8 C -D A 8 C -D A 8 C D- A 8 C D- A 8 C -D
Aelhaloperca rogaa
I3 1
2 11 1
3232
12 12
2
36
Anyperodon leucogramlcus
1
1
115
9
Aphareus rutilans
1
14 1
16
ApTian vlrescens
11
1
12
1
11
9
Cephalopholis argus
7 3 5 6 10 8 4 3 1
6 10 2 1 3 2 8 6 5 13
103
C. leopardus
1
1
C. melampygus
12
11
20 3
28
C. urodeta
4 7 72
1 3 4 2 2 11
13 4
61
58
Chelinus undulatus
1
1
3
13
4
2
15
Epinephelus corall/cola
11
2
E. oynopodus
2
1
3
E. faciatus
51
11
8
E. hexagonatus
3
2
1123
1
1
2 16
E. maoulalus
1
1
2
IE. meffa
4
1
1
22
5
1
1 5 5 3 3D
E. minlata
322
7
E. polyphekadion
31
11
24
12
E. iauvina
1
1
Elagtis blpinnuialus
1
11
3
Gracila albomarginata
25 11
2
2
13
1
18
Gymnosarda unfe%r
2
2
Lutjanus bohar
1 3 3 1 8 3D 2
5
3
4
12
50
113
L. 'ulvus
4
1
3 66 2 1
44
31
L. kasmira
18 3
91
4 29 1 6
2
73
L. monostigma
1
4
4
9
L. ramak
1
11 2 1
20
31
1
40
L. gibbus
11 7 25
5
43
22
15 49 1
1 287 33 1 11 455
Lethrinus miniaius
1
1
2
Plectropomus areolaius
2
1
3
P. !aevis
2
1
37
13
P. pl.urosligma
3
3
ParuPfJneus barb9rinodes
2 22
21
1
11
3 33
Variola loull
1
1
2
Total for each replicate
37 23 64 21 79 58 14 31 45 20 24 21 64 52 36 70 18 13 28 93 271 42 13 19 1158
Total number of fish counted
145
180
110
224
152
345
Mean no of fish counted I
35.3
45.0
27.5
55.0
38.0
85.3

3.5 Page 25

▲back to top
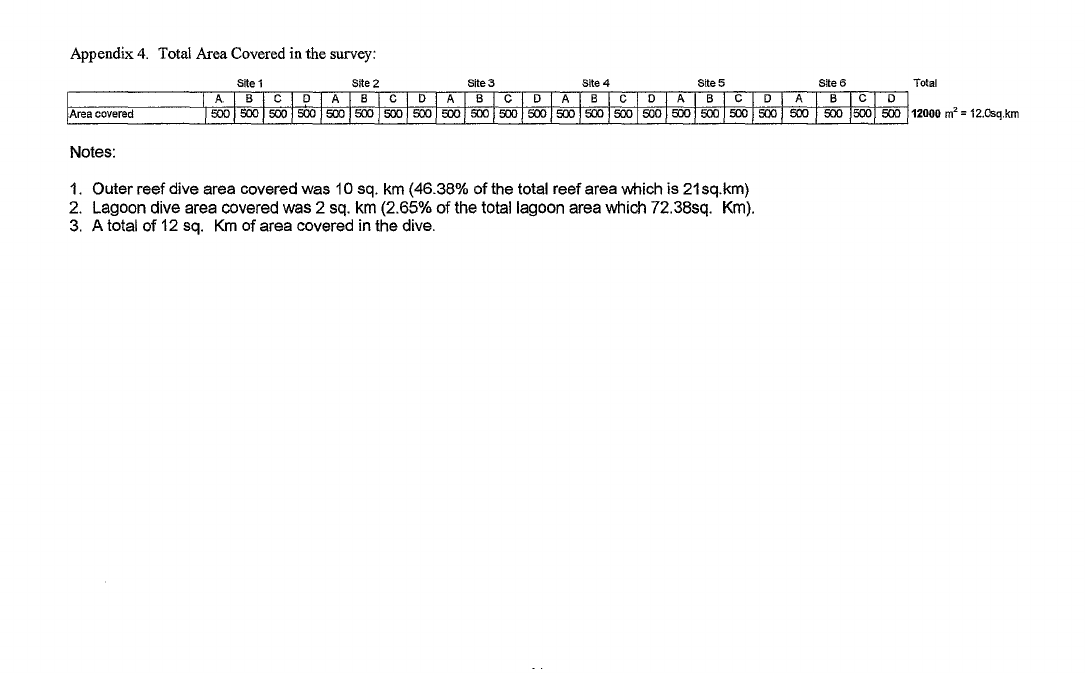
Appendix 4. Total Area Covered in the survey:
i
.4r",,~ "overed
_.•_
_.._ _
_.._ _
_.._
_.._ _
_.._ _
Total
I .. i ... [ ..... I ~ i . i ... I ..... I ~ I .. i n i ..... i .... i .. I ... i .... I r'I. i II i ... I ..... i .... I ... i ... I ..... , ..... i
Notes:
1. Outer reef dive area covered was 10 sq. km (46.38% of the total reef area which is 21 sq.km)
2. Lagoon dive area covered was 2 sq. km (2.65% of the total lagoon area which 72.38sq. Km).
3. A total of 12 sq. Km of area covered in the dive.

3.6 Page 26

▲back to top
Appendix 5 Dinoflagellate Count of Different Algae
Date Site Wt(g) Species algae Spp. Dinoflagellate
29/5/00 lA 650 Galaxaura spp. Gambierdiscus toxicus
Ostreopsis lenticlIlaris
O.siamensis
Prorocentrum lima
P.concavum
30/5/00 lC
600 Halimeda spp. Gambierdiscus toxicus
Ostreopsis lenticularis
O.siamenSl·s
PrOTocentrum lima
P.concavum
30/5/00 1D 450 Halimeda spp. GambierdisclIs ioxicus
Ostreopsis lenticularis
O.siamensis
Prorocentrumlima
P.concavum
31/5/00 2A
400 Halimeda spp. Gambierdiscus toxicus
Ostreopsis lenticularts
O.siamensis
Prorocentrum lima
P.concavum
31/5/00 2B
400 N/Halimeda
Gambierdisclls toxicus
Ostreopsis lenticularis
O.siamensis
Prorocentrum lima
P.concavum
31/5/00 2C
400 N/Halimeda
Gambierdiscus toxicus
Ostreopsis lenticlliaris
O.siamensis
Prorocentrum lima
P.concavum
31/5/00 2D
400 N/Halimeda
Gambierdiscus toxicus
Ostreopsis lenticularis
O.siamensis
Prorocentnmllima
P.concavum
Cl C2 C3 Ave.
000
0
10 0
0
100
0
8 12 4
8
2 10
1
000
0
000
0
000
0
1 0 0 0.333
000
0
13 1
1.6
000
0
0 0 2 0.667
003
1
267
5
000
0
000
0
000
0
0 1 0 0.333
000
0
000
0
000
0
000
0
300
1
000
0
0 00
0
000
0
000
0
0 1 1 0.6667
000
0
0 0 1 0.333
00 0
0
000
0
0 0 1 0.333
1 0 0 0.333
25

3.7 Page 27

▲back to top
Date Site
6/01100 3C
Wt(g)
250
Species algae
NlHalimeda
Spp. Dinoflagellate
Gambierdiscus toxicus
Ostreopsis lenticularis
O.siamensis
Prorocenfrum lima
P.concavum
6/02/00 4A
100 N/Haltmeda
Gambierdiscus toxicus
Ostreopsis lenticularis
Osiomensis
Prorocentrum lima
P.concavum
6/02/00 4A
500 Filamentous
Halimeda
Gambierdiscus toxicus
Ostreopsis lenticularis
O.siamensis
Prorocentrum lima
P.concavum
6/02/00 4B
300 Filamentous
Halimeda
Gambierdiscus toxicus
Ostreopsis lenticularis
O.siamensis
Prorocentrum lima
P.concavum
6/02/00 4B
490 N/Haltmeda
Gambierdiscus toxicus
Ostreopsis lenticl/laris
O.siamensis
Prorocentrum lima
P.concavum
6/02/00 4C
300 N/Halimeda
Gambierdiscus toxicus
Ostreopsis lenticularis
O.siamensis
Prorocentrum lima
P.concovum
6/02/00 4C
300 Filamentous
Halimeda
Gambierdiseus toxicus
Ostreopsis lenticl/laris
O.siamenSis
Prorocentrum lima
P.concavum
6102/00 4D
300 N/Halimeda
Gambierdiscus toxicus
Ostreopsis lenticularis
O.siamensis
Prorocentrum lima
P.concovl/m
Cl C2 C3 Ave.
000
0
0 00
0
000
0
000
0
000
0
0 0 2 0.667
000
0
0 00
0
0 1 0 0.333
0 0 1 0.333
0 0 1 0.333
000
0
000
0
000
0
000
0
0 1 0 0.333
000
0
000
0
000
0
1 0 0 0.333
0 1 1 0.667
000
0
000
0
000
0
0 2 0 0.667
000
0
000
0
000
0
000
0
1 0 0 0.333
0 0 1 0.333
000
0
000
0
2 0 0 0.667
000
0
000
0
000
0
000
0
000
0
1 0 0 0.333
26

3.8 Page 28

▲back to top
Date Site
6/02/00 4D
Wt(g)
225
Species algae
Filamentous
Halimeda
Spp. Dinoflagellate
Gambierdiscus loxicus
Ostreopsis lenticlliaris
O.siamensis
Prorocentrum lima
P.concavum
6/03/00 5A
300 NIHalimeda
GambierdisclIs toxicus
Ostreopsis lenticlIlaris
O.siamensis
Prorocentrum lima
P.concavum
6/03LOO 5A
200 Filamentous
Halimeda
Gambierdisclls toxicus
Ostreopsis lenticularis
O.siamensis
Prorocentrum lima
P.concavum
6/03/00 5B
180 NIHalimeda
Gambierdiscus toxicus
Ostreopsis lenticularis
O.siamensis
Prorocentrum lima
P.concavum
6/03/00 5B
100 Filamentous
Halimeda
Gambierdiscus toxicus
Ostreopsis lenticularis
O.siamensis
Prorocentrum lima
P.concavum
6/03/00 5D
150 Filamentous
Halimeda
Gambierdiscus toX/cus
Ostreopsis lenticularis
O.siamensis
Prorocentrumlima
P.concavum
Cl C2 C3 Ave.
0 1 0 0.333
000
0
000
0
1 0 0 0.333
000
0
000
0
000
0
0 12
1
0 1 0 0.333
0 0 1 0.333
000
0
000
0
000
0
1 0 0 0.333
000
0
000
0
000
0
0 0 1 0.333
021
1
000
0
000
0
000
0
000
0
000
0
000
0
000
0
000
0
000
0
0 I 0 0.333
1 0 0 0.333
27

3.9 Page 29

▲back to top
tJ ~r,,- J;,
j"CUA. CDUUQ). (/"" ~lkrv~ 0 v''J-.-rg h~
rZ:d ( I- -y-
I CT() D ''"Y'' '1-
l~ ) "'-./A; '<
l1 Mcj t- c'- fi' Lv'-~ \\ -t .
28