FFD_AR_1989

1 Pages 1-10

▲back to top

1.1 Page 1

▲back to top
FIJI
FISHERIES
DIVISION
ANNUAL REPORT
1989
MINISTRY OF PRIMARY INDUSTRIES
SUVA

1.2 Page 2

▲back to top
NOR T H
,...
>
WAT E R
..
.. ..Jj
~
WE S T E
,
..• LAUTOKA
'-~
D
0
(PAFCO)
UKA
K0
R
0
C
0
"
..,
~
~
~
"'C,
;IQ
c.,
0
"' S E A
~
, ~ - + - - - - - + - - - - 1 . : a f - - - - , . - - . : : : : - : : J . - - - - i - ~ ' o = = - : - - ~ ~ - ; - - + - - - t : - - ~ - - - - - - - + - - - - - - - - - - ~ - = + - - - - - - - = - c 180
I
.. e I
LAMI
I
NAVUA
)I
I & ·- DIVI 510 N
I
I
I V I S,...,..r.,...~_),1.-
_.,........ - sS ,.()t.
I
q l
_,...- ? ""
...... \\)
.,
l,_............ .. i
I 'f. ,.
, E A S T E.R N
e -. OFFICE
ICEPLANT
~~~
"U
Q LAl<EBA
0
D
VI S I ON
, I
' ;...
I
~-'---------1-'V~U!!.:N211 ~~-;Jl'Y--&::¼-------1-------------1-~-------r0=------19o
I
I
I
- - - -1-79-° - - - - - - - . . - - - - - _ _ _ _ _ _ _.,.....,..~-1-7--9--°~···~•-........._.i,._;;..,.,.,.. '4.• ---

1.3 Page 3

▲back to top
ANNUAL REPORT-1989
CONTENTS
1.
2.
2.1
2.1.1
2.1.2
2.1.3
2.1.4
2.1.S
2.1.6
2.2
2.2.1
2.2.2
2.3
2.4
2.5
2.6
2.4
3.
3.1
3.tl
3.1.2
3.1.3
3.1.4
3.1.S
3.1.6
INTRODUCTION
........................................................................................... 1
TIIB FISHING INDUSTRY ................................................................................... 2
TlIE INDUSTRIAL TUNA FISllERY.......................................... 2
TUNA LANDINGS
POLE AND LINE VESSELS.....................................2
LONGLINE VESSE~ ............................................... 2
PURSE-SEINE VESSELS ..........................................2
PACIFIC FISHING COMPANY ..............................2
TUNA PROCESSING AND SALES
CANNED TUNA .........................................................3
FISHMEAL PRODUCTION.....................................3
THE ARTISANAL FISHERY......................................................... 3
PRODUCTION .................,.......................................... 3
MARKETING .............................................................. 4
THE SUBSISTENCE FISIIERY .....................................................4
AQUACULTURE ............................................................................. 4
EXPORTS ......................................................................................... 5
IMPORTS .........................................................................................5
SUMMARY OFTOTALFISHPRODUCTION.......................... 5
THE FISHERIES DIVISION ................................................................................. 7
ADMINISTRATION ......................................................................... 7
PERSONNEL ...............................................................7
AID PERSONNEL ...................................................... 7
TRAINING RECEIVED ...........................................7
FINANCE ...................................................................... 9
EXPENDITURE
REVENUE
VESSELS .......................................................................9
VEHICLES .................................................................. 9

1.4 Page 4

▲back to top
Fisheries 1989 Annual Report
3.1.7
3.2
3.2.1
3.2.2
3.2.3
3.2.4
3.2.5
3.2.6
3.2.7
3.3
3.4
3.4.1
3.4.2
3.4.3
3.4.4
3.4.5
3.4.6
3.4.7
3.4.8
3.4.9
3.4.10
3.4.11
3.4.12
3.4.13
3.5
3.6
BUILDINGS & PLAN1'.............................................. 10
TECHNICAL/EXTENSION...................................... 10
BOAT BUILDING ......................................................10
FDB LOAN ASSESSMENT....................................... 10
FISHING GEAR SALES ............................................ 10
ICE PRODUCTION.................................................... 10
REGULATORY WORK............................................11
FISH PROCESSING UNIT........................................11
TRAINING GIVEN.....................................................11
EXTENSION SERVICES ................................................................. 12
RESOURCE ASSESSMENT AND DEVELOPMENT .............. 12
COLLECTION OF PRODUCTION DATA........... 12
CATCH STATISTICS ................................................. 12
FISHERY RESOURCE MANAGEMENT ............12
COASTAL ZONE MANAGEMENT ..................... 12
FAD DEPLOY1IBNT................................................. 12
DEEPWATER SNAPPER ......................................... 13
GIANT CLAM PROJECT ......................................... 13
SEAWEED CULTURE ............................................ 13
FR.ESIIWATER FISHERIES ....................................13
MACROBRACHIUM CULTURE ..........................13
PRODUCTION OF MAJOR CARPS ..................... 13
RED TILAPIA ............................................................. 14
RURAL AQUACULTURE PROGRAMME ........ 14
INFORMATION AND LIBRARY SERVICES ........................... 14
INTERNATIONAL LINKAGES ....................................,............... 14
LIST OF TABLES
Table 1.
Table 2.
Table 3.
Table 4.
Table 5.
Table 6.
PAFCO LANDINGS ......................................................................................... 2
FISI:IERMEN BY DIVISION ................................................................................. 3
VESSELS BY DMSION ........................................................................................ 3
LOCAL FISH PRODUCTION .............................................................................. 6
STAFF STRUCTURE ......................................................................................... 9
DIVISIONAL EXPENDITURE ............................................................................ 8

1.5 Page 5

▲back to top
Fisheries 1989 Annual Report
Table 7.
Table 8.
Table 9.
.DMSIONAL REVENUE ...................................................................................... 8
FISHING GEAR SALES ......................................................................................... 11
ICE PRODUCTION
11 •••••••~••••••••••••••••••••••••..•••••U•..••••....+1••••..•••••••11+1+11••••••..•••••••••••••••
LIST OF APPENDIX FIGURES
Figure 1
Figure2
Figure3
Figure 4
Figure5
Figure6
Figure 7
Figure8
Figure 9
Figure 10
Domestic commercial fish production 1978-89
Domestic commercial non.fish production 1978-89
Total domestic fish supply 1978-1989
Total catch from Fiji waters 1978-1989
Domestic Marketing Structure 1978 vs 1989
Domestic Fishery production as GDP
External Fisheries trade balance
Fishing Licences, vessels & crew 1978-1989
Ice production by Fisheries Division 1978-1989
Consumption per head
LIST OF APPENDIX TABLES
Table 1
Table2
Table 3a
rable3b
Table 4
Table5
Table 6
Table7
Table 8
Table 9
Table 10
Table 11
Table 12
Table 13
Table 14
Table 15
Unloading quantity by boat (PAFCO)
Unloading quantity by species (PAFCO)
Glossary of Fijian food fish names
Glossary of Fijian non-fish names
Price of fish at municipal markets
Price of non-fish at municipal markets
Volume of fish at municipal markets
Volume of non-fish at municipal markets
Fish sales by Division
Non-fish sales by Division
Fish volume at other outlets
Non-fish volume at other outlets
Summary of domestic commercial sales
Exports
Re-exports
Imports

1.6 Page 6

▲back to top
Fisheries 1989 Annual Report
1. INTRODUCTION
This report provides details of Fiji fisheries sector production during the calendar year 1989; together with
a summary of the activities of the Fisheries Division during this period.
1989 was the fourth year of the Development Plan 9 period (1986-1990). The major thrust of Government
policy during D:P8 was to encourage fisheries development for subsistence, commercial and industrial
purposes. The objectives of the fisheries sector during DP9 are to:
• generate further employment opportunities in the exploitation and processing of marine products.
• increase production to satisfy local demand for fish and other marine fish products.
• increase value added to fish production for export.
• regulate and control the exploitation of fin and non- fin fishery products.
Within these broad guidelines there is a continual process of policy review, and several major changes in
the Fiji fishing industry since DP9 was formulated have necessitated some revision of specific priorities.
The recent unprecedented increase in the domestic longline fleet has made the.provision of suitable fish-
ing port facilities and infrastructure an urgent necessity, and the rapid increase in fisheries sector exports,
particularly ofnonfin-fish sedentaryresources, has required more stringent exploitation control measures.
During 1989 small scale commercial (artisanal) fisheries production decreased by7% to 6;377 tonnes, and
the value increased by 17.4% to approximately F$17.5 million. A small increase in fish production was
offset by a large decrease in non-fish (shellfish and crustacean) production.
In the industrial sector, the local tuna catch increased marginally by 4.5% to 9,587 tonnes. Longline alba-
core tuna landings were down by 28% on 1988, but this was offset by a very good year for the skipjack pole
and line fleet whose catch was up by 37%. The PAFCO tuna cannery at Levuka decreased its tuna intake
slightly (to 14,531 tonnes) but sold a creditable $40.7 million worth of canned fish, mainly to export mar-
kets in the UK and Canada.
Development in the deepwater snapper fishery was slowed somewhat by the diversion ofmany ofthe larger
snapper boats into the "sashimi" tuna longline fishery. This development provided some respite to snap-
per stocks, which would have been threatened by overfishing if expansion had continued at the 1988 rate,
and exports of high-quality chilled tuna look set to become a major earner of foreign exchange in 1990.
After grave concern about the future of the fledgling seaweed growing industry in 1988, new private in-
vestment and an upturn in the world market price for dried seaweed promise to get the industry back on
its feet and to turn seaweed farming once more into a significant vehicle for rural development.
The economic hardships and new economic policies of the past couple ofyears have had major effects on
the Fiji fishing industry. Whilst the Fisheries Division remains committed to the task of developing under-
exploited fisheries and improving incomes and employment prospects for fishermen, particularly for rural
and small-scale fishermen, the Division is forced to turn more of its attention to the regulation of overex-
ploitation than in the past. Only by ensuring the future of resources can we ensure the long-term future
of the fishing industry. Further commercial development should ideally be concentrated on the outer-reef
and oceanic fisheries, and the Division must make fishermen aware of the possibilities and provide sup-
port in the form of training, vessels, infrastructure, and advice on improving the value of catches through
better handling and further processing. Aquaculture is another approach, with impressive growth- pros-
pects, and of particular benefit to the inland population, but which needs a lot of development work.
1990 will be a particularly challenging year for the Fisheries Division.
1

1.7 Page 7

▲back to top
Fisheries 1989 Annual Report
2.1 THE INDUSTRIAL TUNA FISHERY
2. THE FISHING INDUSTRY
The Fishing Industry is generally divided into four primary sectors, although the distinction between these
is becoming less clearcut as they develop and diversify. They are:
• The industrial fishery, which operates on a large scale and is primarily export oriented. This involves
mainly the PAFCO tuna cannery at Levuka, and tuna capture and supply by both local and over-
seas vessels. The deepwater snapper and th_e domestic tuna longline fisheries will be included in
this category from 1990 onwards.
• The artisanal fishery. This sector includes most small- scale commercial production for domestic
sale. It is a significant source of domestic fish-supply and employment.
• The subsistence fishery, involving catches for self- consumption, with the occasional sale of surplus
catch.
• Aquaculture is receiving increased attention in Fisheries development, but remains largely ex-
perimental. Aquaculture has the advantage of not being based on limited natural fish resources, but
often requires a comparatively large investment.
2.1 THE INDUSTRIAL TUNA FISHERY
TUNA LANDINGS
2.1.1 POLE AND LINE VESSELS
·The Pole and line fleet of 8 vessels: 3 IKA owned; 2 chartered Hohsui; 1 chartered Solander and 2 other
Fiji privately owned continued to fish in Fiji waters. IKA Corporationbuilt and commissioned 2 more pole
and line vessels in 1989, and these -..vill join the fishing fleet for the 1990 skipjack season.
4 pole and line vessels from Kiribati and one from Tuvalu, chartered to the Pacific Fishing Company
(PAFCO), also unloaded 750 tonnes of tuna (caught in Fiji waters) in 1989.
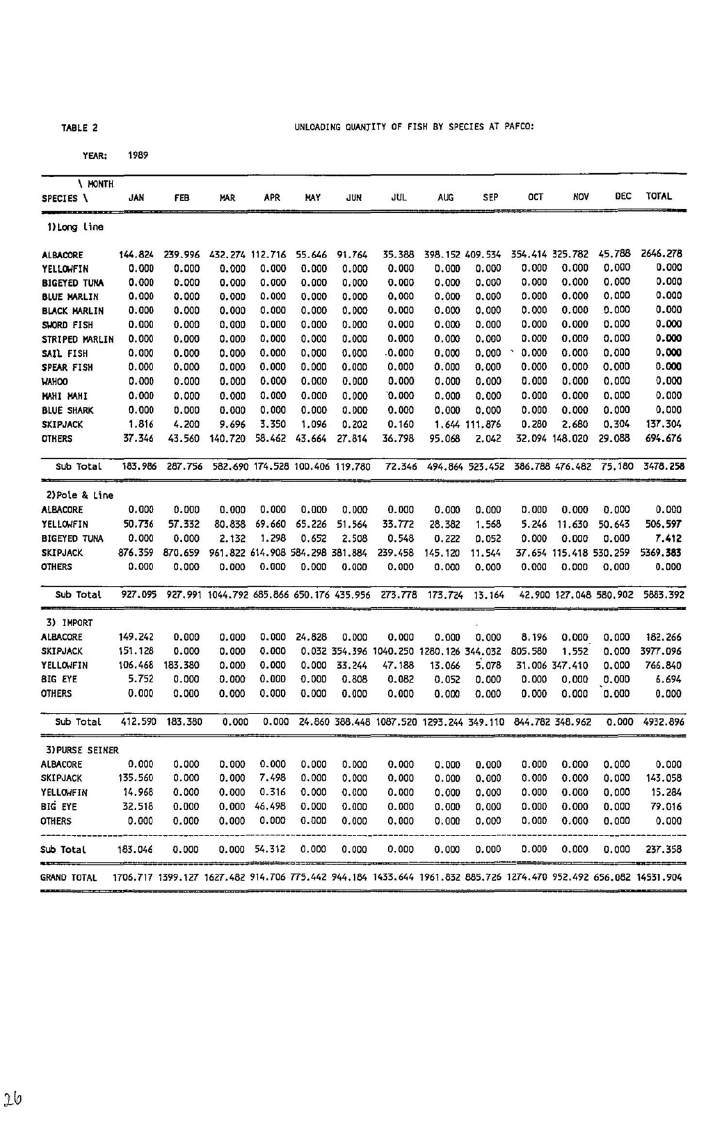
A total of 5,883 tonnes of tuna (94% of it skipjack) was landed and sold to Pacific Fishing Company by
the pole and line fleet (see Table 1 for details). This was a 37% increase in pole and line landings over
1988 for an approximate 20% increase in effort.
2.1.2 LONGLINE VESSELS
A total of 22 Taiwanese longline vessels were contracted by PAFCO during 1989..Tettal landings of fish
were 3,478.25 tonnes, and landings were down by 28% compared to the 1988 catch of 4,886.98 tonnes.
2.1.3 PURSE-SEINE VESSELS
A small Filipino purse-seiner was contracted by PAFCO to fish in the Fiji EEZ on a trial basis during the
first quarter of 1989. Despite setting nearly 70 fish-aggregation devices, catches were disappointing and
poor weather forced the vessel to seek shelter for a significant part of the time.
2.1.4 PACIFIC FISHING COMPANY
PAFCO received a total of 14,531 tonnes of fish in 1989 (excluding frozen fish re-exports of 763 tonnes),
sUghtlybelow the 1988 figure due to the major upgrading works being carried out at the cannery. The per-
centage of cannery throughput that had to b~ imported dropped to 33% from the 42% r'ecorded in 1988.
Tuna was imported mainly from Kiribati and the Solomon Islands. Total landinii& at PAFCO decreased
by 8.2% compared to 1988.
2

1.8 Page 8

▲back to top
2.2 THE ARTISANALFISHERY
Fisheries 1989 Annual Report
Table 1 PAFCO LANDINGS OF FROZEN TUNA
Source
1989Tonnes
Pole and Line vessels
5.883
......<Tti...e vessels
3.478
Purse Seine vessels
237
lrmnorted
4.933
rotal
14531
{See Appendix Tables 1 and 2)
% of Total
37%
23%
2%
34%
1988Tonnes
4.288
4,887
0
6.649
15.824
TUNA PROCESSING AND SALES
2.1.5 CANNED TUNA
A total of 868,049 cartons (48 x 7oz equivalent) of caruied fish were produced; a decrease of 23% over
1988. During the year, 771,737 cartons of tuna valued at $39.7 million were exported (plus 126,400 cartons
ofpetfood, valued at $2,387,978), and 32,963 cartons of-tuna valued at F$1.0 million were sold locally.
PAFCO also exported 763 tonnes of raw fish valued at F$2.7 million .
2.1.6 FISHMEAL PRODUCTION
In 1989, 1,660.4 tonnes of fishmeal were produced, a 17.6% increase over 1988. The WS( lmlJOrity of tliil
was sold locally for $1.1 million
2.2 THE ARTISANAL FISHERY
The artisanal (small-scale commercial) fisheries sector is an increasingly diverse one, ranging from village
fisherwomen collecting shellfish in rivers, to larger vessels fishing offshore for ckepwater snappers for ex-
port. Production data for this sector is collected by the Fisheries Division and all persons taking fish by
way of trade or business are required, under the Fisheries Act, to obtain a license. Table 2 lists the num-
ber of licensed fishermen by administrative division and Table 3, the n~ber and type of licensed fishing
vessels per Division. This serves as a crude index of the level of artisanal fishing activity.
Table 2. FISHERMEN BY DIVISION .. 1989
Division
No of Licenses
IDA
ODA
Crew
Central 261
267
1647
(includin2. Kadavu)
Western 632
39
1406
Northern 487
101
1152
(64% Fiiian.,22% Indian.14% other'
Eastern
53
17
170
TOTAL 1433
424
4375
NOTE:
• IDA - Inside demarcated (customary fishing rights) areas
a ODA- Outside demarcated (customary fishing rights) areas
a ~davu (officially part of Eastern Division) licence issues were handled througn the Central Divi
s1on.
0 No IDA licences were issued for commercial fishermen to fish in traditional fishing grounds of the
Lau Province (Eastern Division), at the request of Tui Nayau.
This is an increase in license -issues of 4% relative to 1988.
3

1.9 Page 9

▲back to top
Fisheries 1989 Annual Report
2.2 THE ARTISANAL FISHERY
Table 3. VESSELS BY DIVISION - 1989
CENTRAL WESTERN NORTHERN EASTERN
Unnt1wered '267
84
107
19
Outboard 215
603
319
33
iinboard 270
67
105
23
... OC'OTAL 752
754
531
75
Note: Kadavu vessels were registered through the Central D1V1s1on
TOTAL
477
1170
465
2112
2.2.1 PRODUCTION
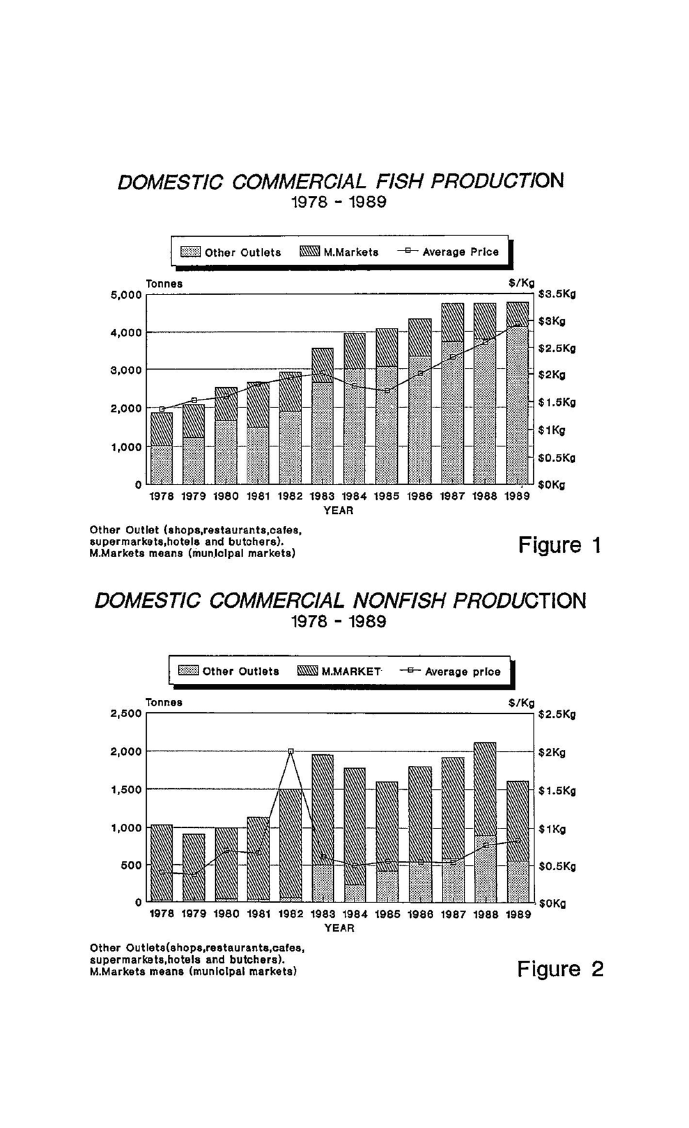
An estimated 4,768 tonnes of fresh or frozen fin-fish worth $14.7 million were sold through various out-
lets in 1989, an increase in weight by 0.4%, and an.increase in value by 23% over 1988. The predominant
fish families in the catch were emperors (Lethrinidae) - 139 tonnes, mullets (Mugilidae) - 369 tonnes, mac-
kerels & tuna (Scombridae) - 921 tonnes, and groupers (Semmidae) - 601 tonnes. These 4 categories
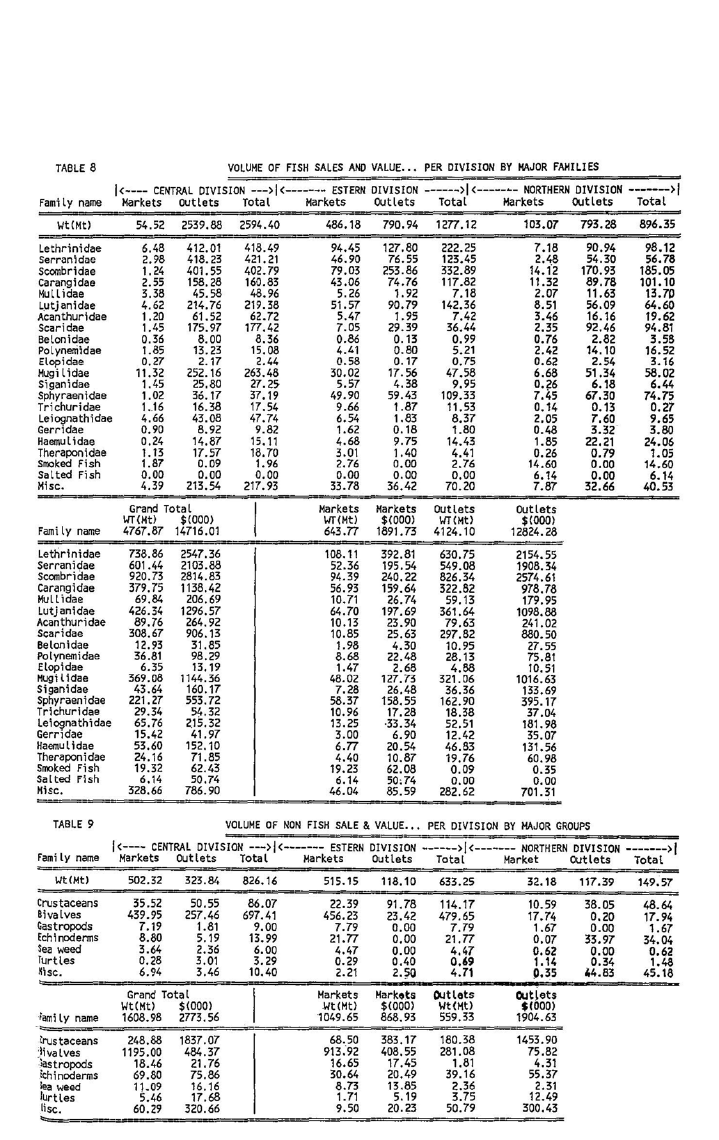
together made up 55% of the total artisanal fish catch (see Appendix Table 8). Figures on production by
area are difficult to obtain, but about 54% of the fish was sold in the Central Division.
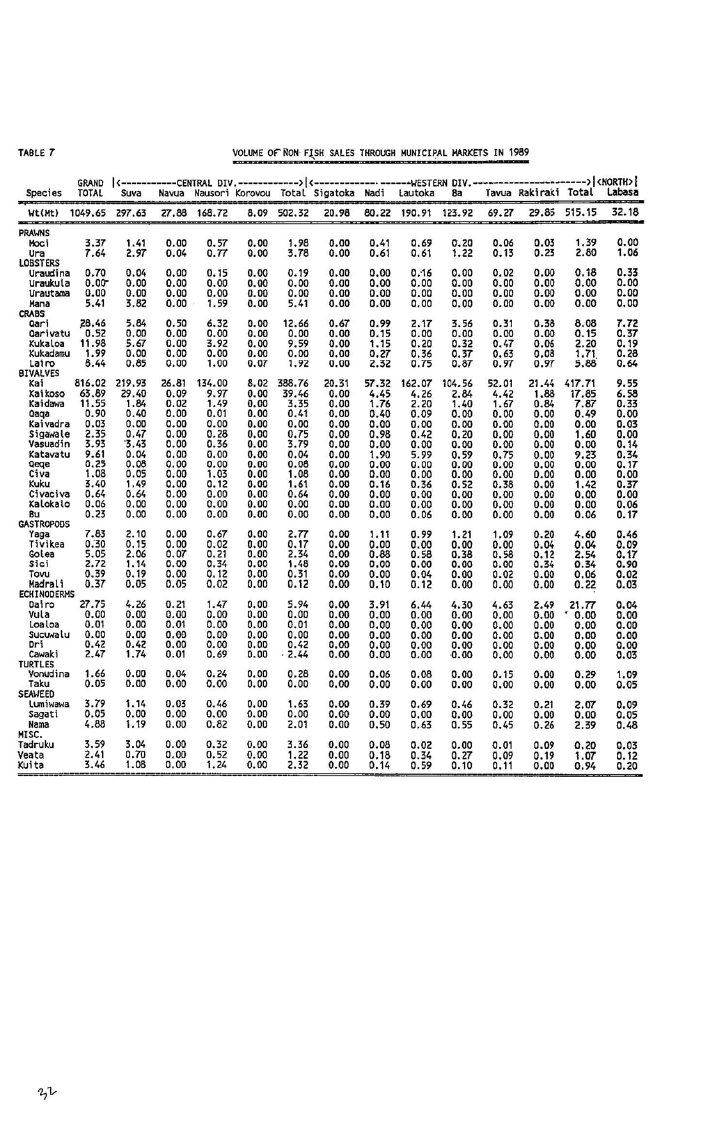
Non-fish sales (i.e. shellfish, crustaceans, molluscs, holothurians, seaweed etc.) totalled 1,609 tonnes,
worth $2.8 million. This was a decrease of24% by w~ight and a decrease of 2.1% by value over 1988. The
freshwater kai (Batissa spp) accounted for 68% of this production by volume, with mangrove crabs (Scylla
spp.) - 80 tonnes - and rock lobster (Panulirus spp.} - 53 tonnes - contributing disproportionately to the
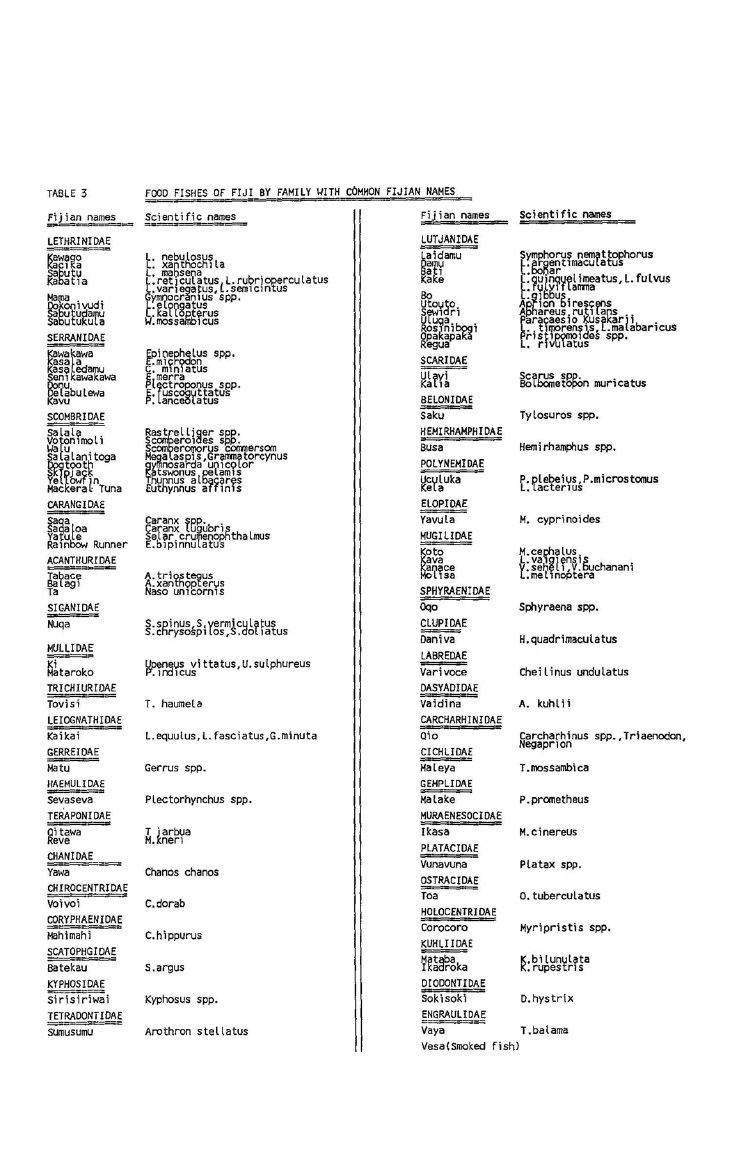
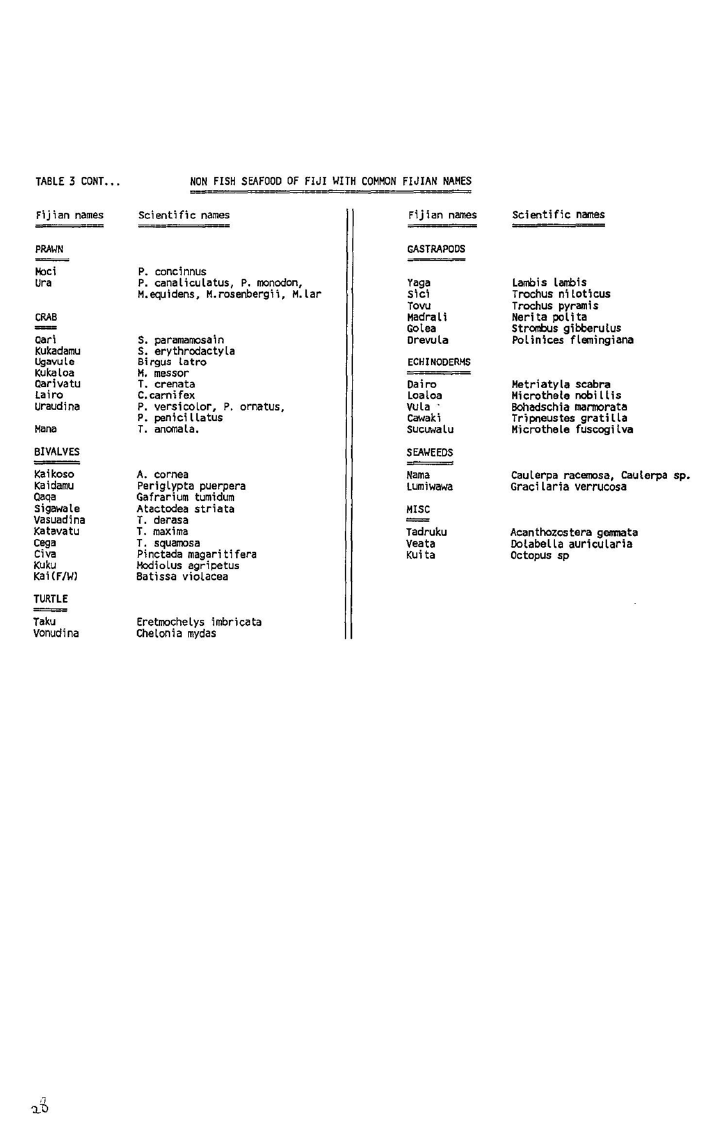
total value (see Appendix Table 9). Appendix Table 3 provides a guide to common Fijian fish and non-
fish names.
2.2.2 MARKETING
The product is sold through a variety of outlets which can be broadly grouped into six categories as fol-
lows:-
• Municipal markets
0 Hotels
• Restaurants and Cafes
• Butchers and Fish Merchants
• Retail shops and Supermarkets
• Roadside stalls and the National Marketing Authority
Price information is obtained by interview for market sales, but is not generally available for other outlet
categories.
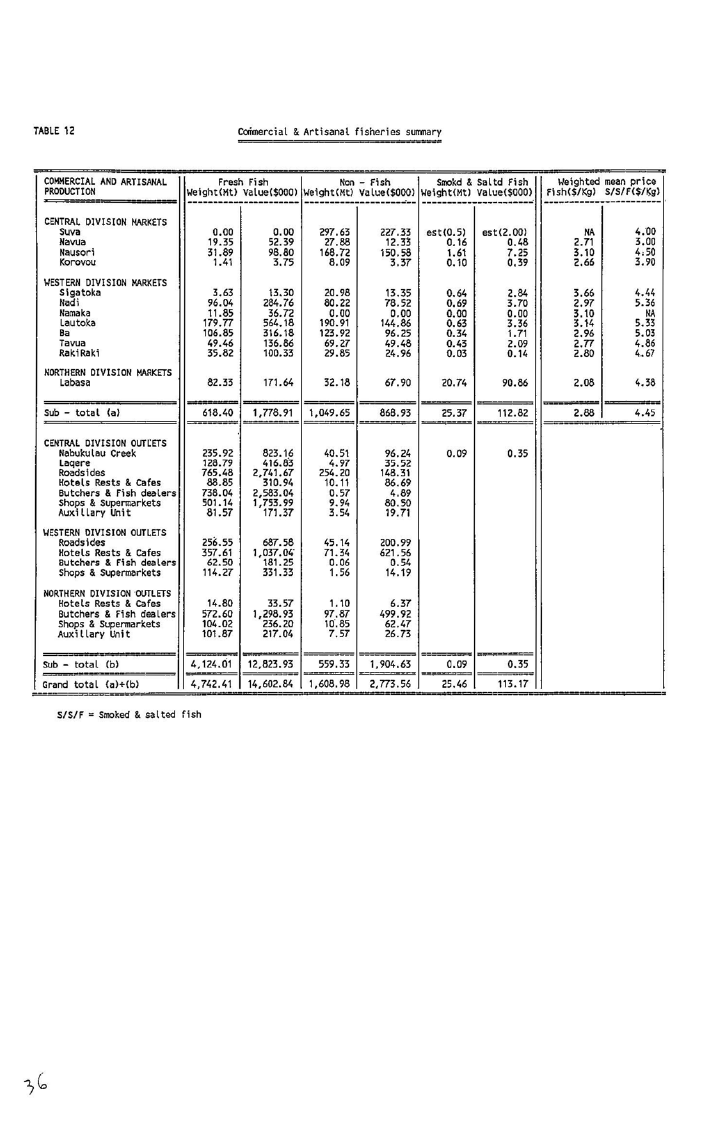
The relative importance of these various outlet categories varies by Division, as Appendix Table 12 dem-
onstrates. Notable features are the importance of the unique wholesale butchers in the Central Division,
municipal markets in the Western and Northern Divisions, and roadside sales in tile Western Division.
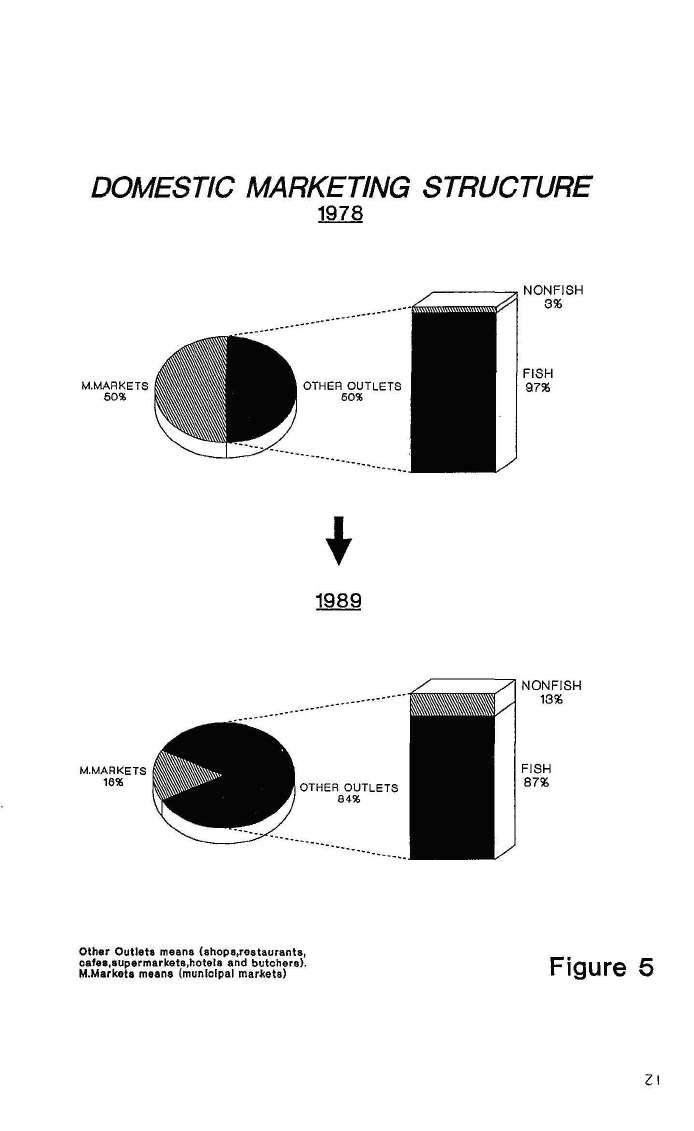
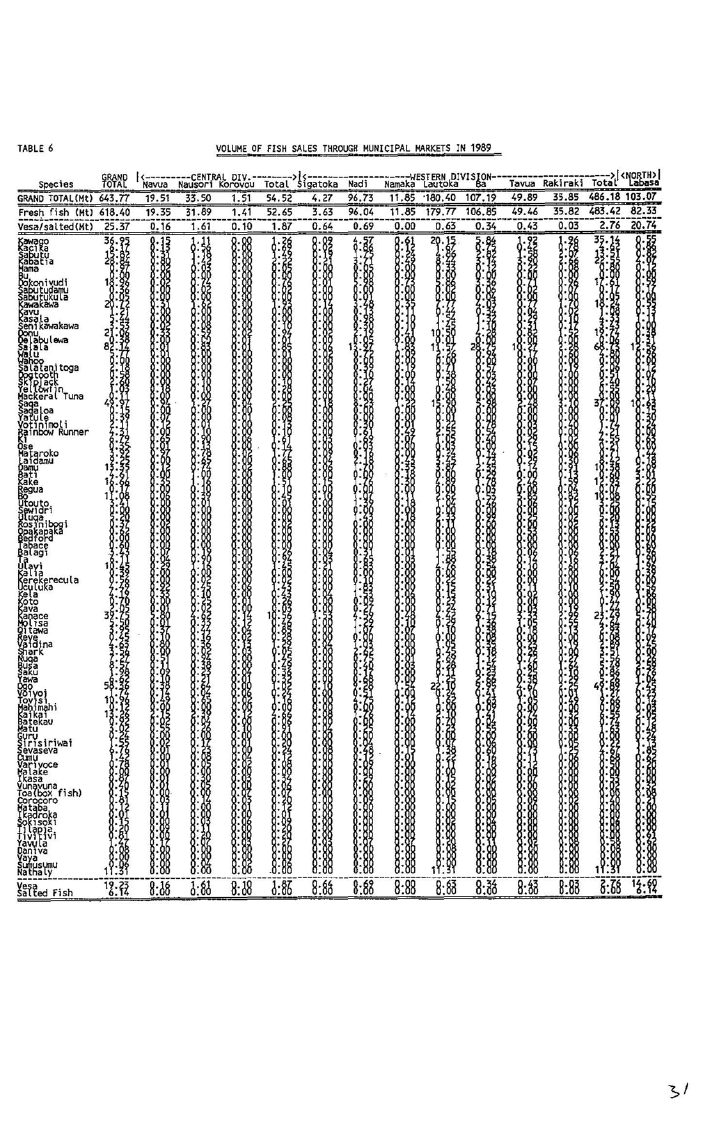
Sales offish through Municipal Markets have steadily declined, particularly in theCentral Division. In the
Northern Division also, increasing quantities of fish are diverted to Central Division outlets for sale. Only
14% of fish sales were made through Municipal Markets in 1989 (compared with over 40% in 1981) al-
though this market share appears to now be steady. On the other hand, municipal markets still handle
most non-fish sales (62% share), although this is overwhelmingly kai.
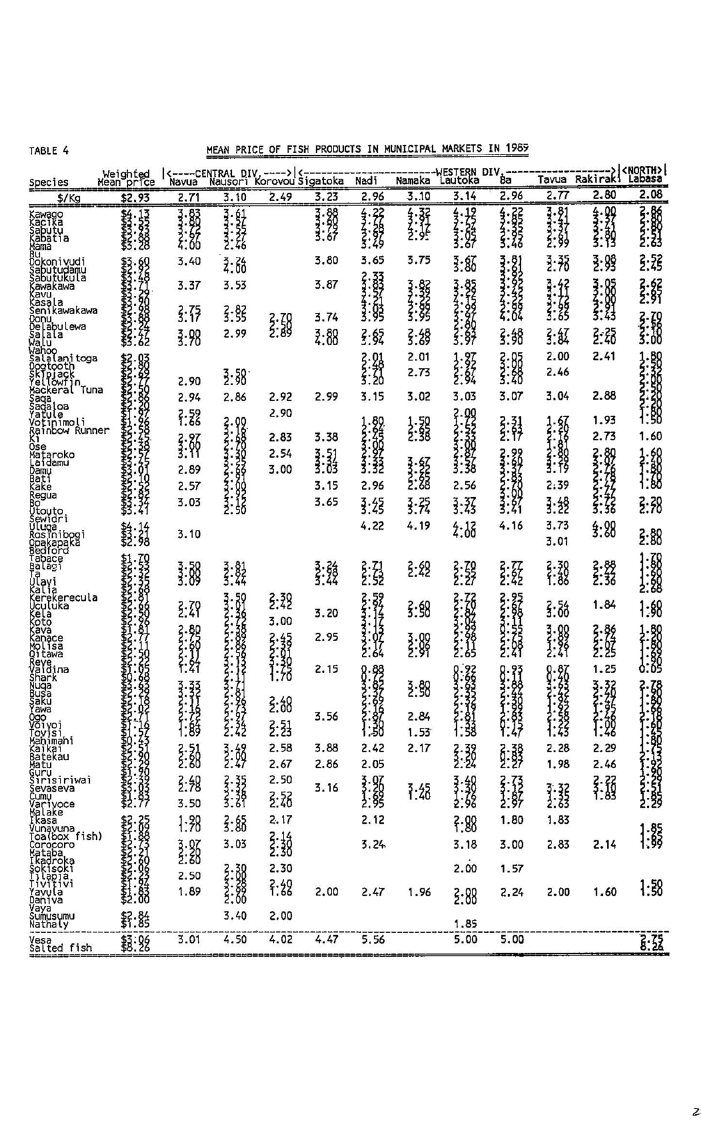
Weighted mean prices for most products have shown relatively small increases from 1982 to 1988, but the
latter part of 1988 appeared to presage a slight rise in price and 1989 prices showed a dramatic increase.
The total average price of finfish for 1989 was 32% higher than 1988. Rises were experienced by many
of the more valuable non-fish products, although high-volume staples, such as kai, remained at 1988 le-
vels despite a great reduction in supply.
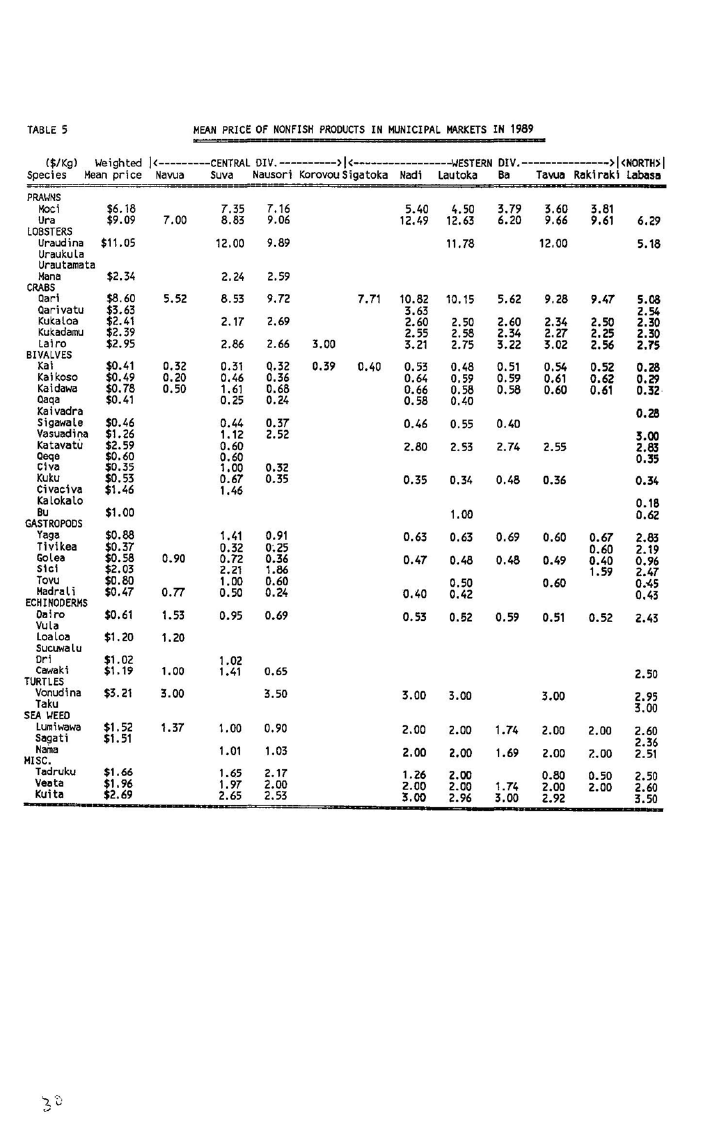
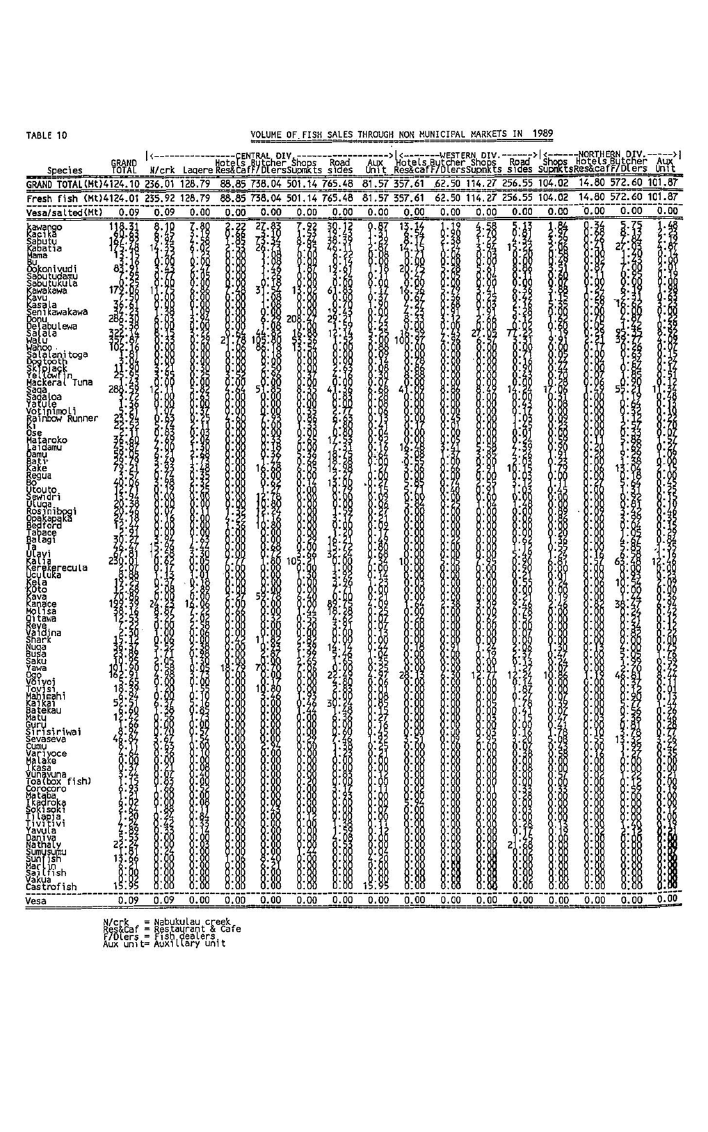
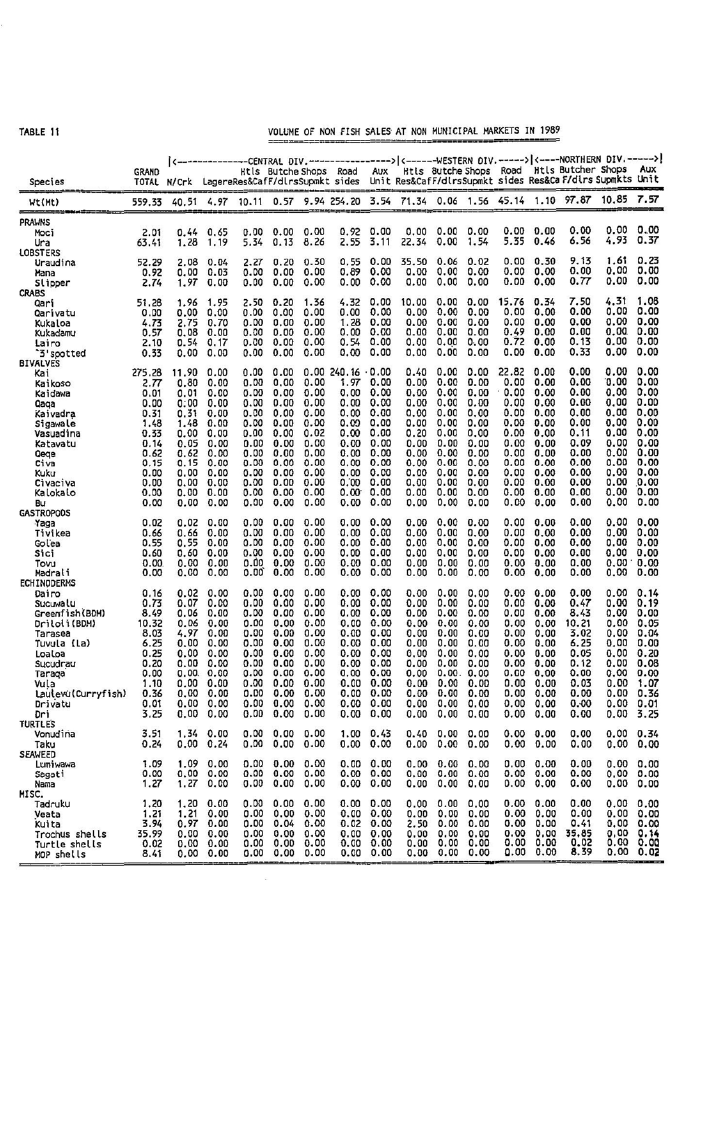
Appendix Tables 6 to 11 provide details of artisanal fish and non-fish production for 1989 in municipal
markets and other outlets.
4

1.10 Page 10

▲back to top
2.3 THE SUBSISTENCE FISHERY
Fisheries 1989 Annual Report
2.3 THE SUBSISTENCE FISHERY
Reliable estimates ifthe subsistence catch (fish and non-fish) are not available. An estimate of14,000 ton-
nes per annum, obtained in 1980 from an interview survey of approximately 9% ofFijian coastal villages,
is normally used, with an annual increment of 200 tonnes.
2.4 AQUACULTURE
The Raviravi aquaculture site, developed bytheFisheries Division to test the feasibility of aquaculture on
a recently-reclaimed mangrove area, and lately operated by a Fiji Development Bank-France Aquacul-
ture joint venture, Prawns (Fiji) Ltd., was taken over by an Australian company in 1989. The farm, pro-
ducing penaeid shrimp, has performed well below potential for the past few years, and this takeover is
hoped to lead to improvements. The Fisheries Division has seconded a Senior Fisheries Officer to man-
age the farm until full-scale production is attained.
Macrobrachium rosenbergii prawn development work at the Division's Naduruloulou Research Station
was severely impeded by the breakdown of the main water-pumping system, and the start of commercial
trials was delayed at least 9 months until feeding regimes can be properly assessed.
88 tonnes ofdried Eucheuma seaweed were exported to Copenhagen for final processingby the Fisheries
Division/NationalMarketingAuthorityduring theyear, andthe newprivate-enterpriseseaweed company,
Seaweed (South Pacific) Ltd., is expected to take over export marketing early in 1990. Seaweed farming
isbeginning to show promise ofa rapid recoverywith the rise in world market price and a regaining ofin-
terest by rural farmers.
2.5 EXPORTS
Exports were dominated as always by canned tuna (7,185 tonnes, valued at $39.4million) but included in-
creasing quantities of fresh fish (deepwater snappers and tunas) (235.47 tonnes valued at $1,096,928). A
marked drop of at least 50% was noted in exports of beche-de-mer and pearl shell, and trochus exports
showed a similar, ifless dramatic, drop. These reductions are probablyattributable to overinvestment and
overfishing during the previous 2 years, but the causes are still under investigation.
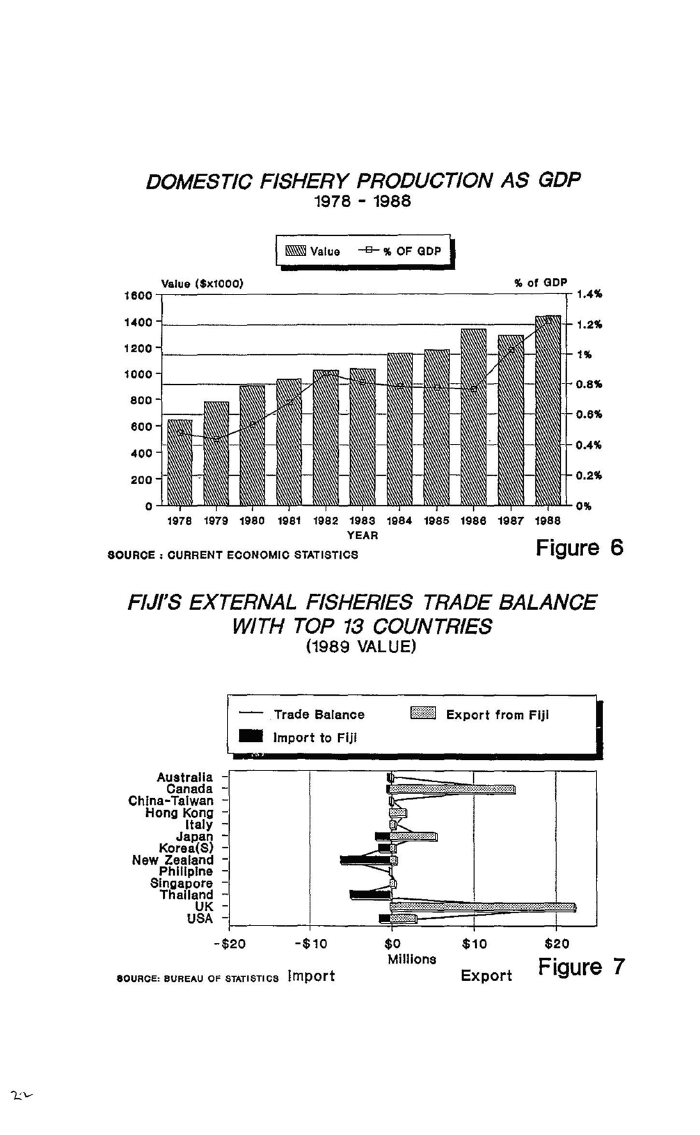
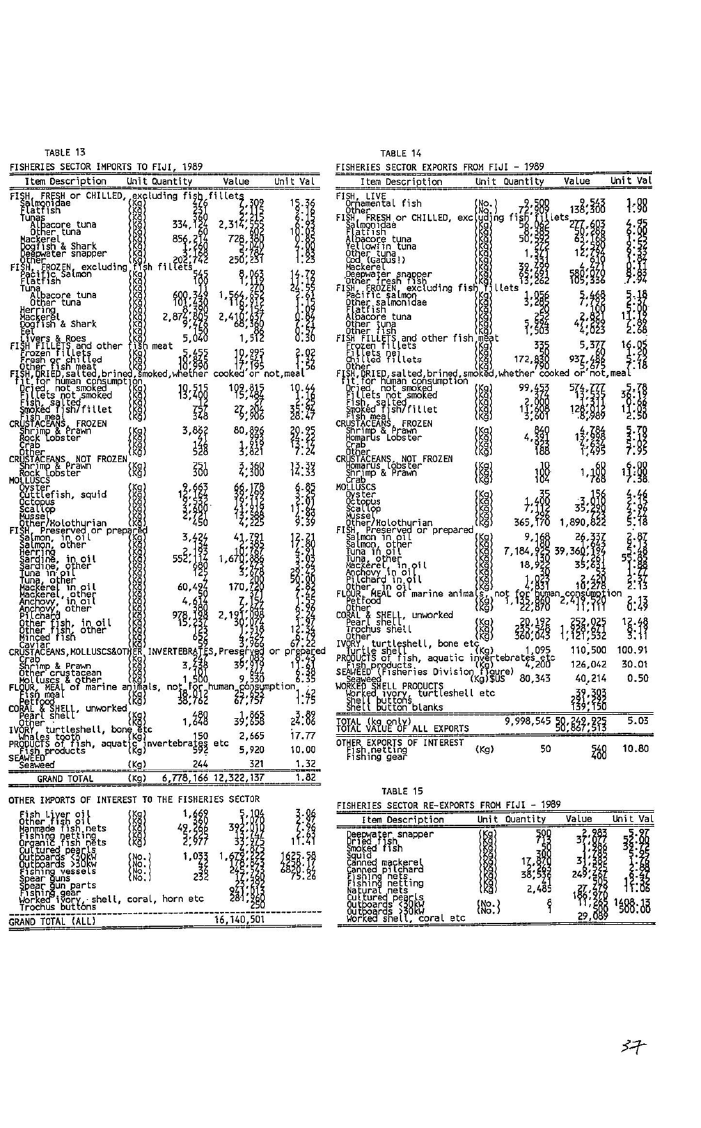
AppendixTables 13and 14list the Bureauof Census and Statistics figures for exports and re-exports from
Fiji. Of those categories surveyed, exports totalled $50.83 million (a 0.7% decrease over 1988) and re-ex-
ports totalled $0.59 million.
Itshouldbenotedherethat thesefigures are obtainedfrom the Comptroller ofCustomsvia theFijiBureau
of Statistics, and that a new harmonised tariff coding system was introduced at the start of 1989, so some
of these figures may not be strictly comparable with the 1988 figures. The system appears to have a few
teething troubles and products are occasionally misclassified, but it promises i,,. the long run to be a great
improvement for the purposes offiner analysis. The Fisheries Division plans to classify each fisheries ex-
port permit with the Statistical code in 1990 to assist Customs officers.
2.6 IMPORTS
AppendixTable 15 lists the Bureau ofCensus andStatistics figures for imports into Fiji dllrllJ8 1989. The
total value of those fishery products listed was $11.7 million (a 60.6% decrease over 1988), of which the
largest part was tuna and mackerel to supply local canneries.
5

2 Pages 11-20

▲back to top

2.1 Page 11

▲back to top
TABLE 4
cLAssI FicATION
SUMMARY OF LOCAL FISH PRODUCTION 1985 - 1989
1985
Wgt
Value
MT
$1000
1986
Wgt
value
MT
$1000
1987
Wght
Value
MT $1000
1988
Wght
Value
MT $1000
1989
"
Wght
Value
MT $1000
ARTISANAL FISH
Municipal Markets
NMAIAuxi Llary
Other outlets
Smoked Fish
Salted Fish
980.93
379.33
2691.04
27.30
5.10
1638.20
656.93
5727.20
61.00
20.50
963. 11
240.53
3113.77
16.33
4.45
1916.59
478.65
6196.40
35.93
21.49
969.91
122.38
3617.94
24.95
2. 13
2247.90
279.03
8863.95
67.23
5.81
897.97
3811,96
32.47
5.83
2289.83
9580.57
95.06
43.35
618.40 1778.91
183.44 388.41
3940."57 12435.52
19.32 62.43
6.14 50.74
sul5 - fofa[
:z;:083.70 8103.83 2';338.19 8649.07 :z;:737 .31 11463.92 Z/1.8.23 12008.81 7;767.87 12';716.0T
ARTISANAL NONFISH
Municipal Markets
NHA & Other Outlets
1175. 70 643.83 1259. 18 681. 19 1336.88 718,86 1217.91 935.34 1049.65 868.93
423.38 359.40 544.55 856, 11 590.31 1035. 21 901.67 193~.69 559.33 1904.63
su5 - fofa(
1599.08 1003. 23 1803.73 1537.30 1927. i9 1757+. 07 2119.58 2867.03 Hi08.98 2773.si
INDUSTRIAL FISHERIES
Pole & Line
Purse seine
Long Line
Other (Import)
3252.00 2325.10 3119.34 2220.00 3885.00 2800.00 4288.02 4000.00 5883.00 NIA
693.00 497.10
237.00 N/A
2105.60 3751.50 1237, 20 1730.00 2361.44 8400,00 4886.98 12600.00 3478.00 NIA
2374.20 1620.50 5924.00 5224.62 4832.64 4400.00 6649.55 10900.00 4933.00 NIA
sul5 - fota [
Bait (Pole &Line)
tst.2:z;:.80 8194.20 Hl280.5l; 917Z. !i2 lHlW.-08 15600.00 t58ZZ:.55 27500.00 14531.00
57.20
59.70
50.00
55.00
60.00
SUBSISTENCE (est.)
15000.00
15200.00
15400.00
15600.00
15800.00
CANNERY PRODUCTION
Canned Fish (ctn)
Fish Meal
436315.00
602281.00
706860.00
652. 18 324.70 771.00 394.45 1118.00
888688.00
1411.60
868049.00
1660.45 1103. 66
EXPORTS by mt
Shark fin
Trochus
MOP
Beche-de-Her
Frozen Crab
Frozen fish -OTHERS
-PAFCO
Chi l led Fi sh
Dried seaweed
Smoked Fish
Fish dried salted
Crustaceans &Molluscs
Fish Hea L
canned fish
10.82
274.00
16.10
66.20
0.04
26.60
1823.00
18.66
108.20
534.30
56.00
660.00
0.18
133.00
3300,00
67.24
10.13 106.97
17. 21 118. 19
0.01
0.01
3088. 51 10884.71
8.32
233.66
12.34
229.38
N/A
88.77
186.00
38.51
173.41
0.04
8.32
15.85
10.79
4570.49
84.36
738.99
45.12
886.67
N/A
309.66
180.68
147.50
135.29
0. 11
84.36
85.99
15.41
16679.99
6.33
250,44
23.18
640.39
N/A
120.45
926.03
42.82
216.89
11.24
36. 21
240. 71
0.90
4767.97
44.33
986.78
147.04
2233.46
NIA
653.95
2950.00
277.90
136.87
44.32
153.67
883.30
15.20
20780.80
NIA
398.47
57.50
717.41
N/A
72.24·
NIA
2010.42
465.16
2852.27
N/A
423.25
172.41
60.30
1.66
55.56
362.20
156.40
6964.59
841.30
21.11
8.05
411 .90
1709.95
483.72
39757.46
NIA
NIA
235.55 1928. 67
20.19 252.03
365.17 1890.82
1.03
1. 20
12.00 949.00
763.38 2701.77
409.00 2045.50
80.34 40. 21
11.61 128. 01
101.30 589.62
15.40 66.02
3.60
8,99
7219.21 39443.82
Sub - total
5351. 29 15968.80 5329.88 18610.02 7283.56 29307.62 9018.74 48984.59 9002.23 50045.66
EXPORTS by miscellaneous unit
Aquarium Fish (no)
59404.00
Canned Fish (ctn) PAFCO 450198.00
Corals & others
Worked shells
96.48 71840.00
12497.10 615994.00
103.33 83109.00
19500.00 669943.00
117.34
152.69
143.73 72044.00
25780.00 340688.00
136.36
248.03
329. 14 82409.00 147843.00
4~600.00 771737.00 39700.00
159.28 NIA
318,60 N/A 469745.00
Sub - total
12593. 57
19873.36
26308. 12
47407.02
Domestic canned ctn
7400.00 108.86 8192.00 162.98 17634.00 373.81 48000.00 1400.00 32963.00 1003.47

2.2 Page 12

▲back to top
2.7 SUMMARY OF LOCAL FISH PRODUCTION
Fisheries 1989 Annual Report
2.7 SUMMARY OF LOCAL FISH PRODUCTION
Table 4 summarises local fish production (both for local consumption and export) over the years 1984-
1989. Artisanal fish production has increased by 21.6% in that period, and non-fish production has de-
creased by 9.6%. The decrease in non-fish production occurred in 1989 after a steady rise through the
previous four years, and is largely due to a sharp drop in freshwater clam (kai) sales. A possible reason
for thls is the disturbance to kai beds by dredging work in the Rewa river, which is the main kai-produc--
ing area, but socioeconomic and climatic factors may also be significant.
3. THE FISHERIES DIVISION
The Fisheries Division, of the Ministry of Primary Industries, has its headquarters at Lami, on the west-
ern outskirts of Suva. The four administrative Divisions of Fiji are the primary organisational units, and
Fisheries has Divisional officesinLautoka (WesternDivision), Labasa (NorthernDivision), Na:usori (Cen-
tral Division) and Lami (Eastern Division). Respectively, these service subsidiary offices in Rakiraki,
Tavua, Ba and Sigatoka (Western), Taveuni, Savusavu and Nabouwalu (Northern) and Lakeba, Vunisea
and Levuka (Eastern).
3.1 ADMINISTRATION
3.1.1 PERSONNEL
At the end of 1989, 98 ofthe 118 established posts were occupied.10 posts are present in Administration,
82 in Technical Services and Extension and 26 in Resource Assessment & Development. Staffmg de-
creased by 8% over 1988 levels.
Table 5. FISHERIES DMSION STAFF STRUCTURE
DESIGNATION
SCALE
Director of Fisheries
USO3
IPrincioal Fish. Officer NSOl
Senior FJSheries Officer NSO2
fisheries Officer
NSO3
Graduate Trainee
NSO4
J?isheries Tech Officer NSO5
Senior Fisheries Assistant NSO6
~ibrarv Assistant
ADO6
Hxecutive Officer
ADOS
!Assistant Accountant ADOS
Senior/Clerical Officer ADO6
Steno2raoher/ Tvaist
RTO6
Stores Officer/Storeman SKO6
rOTAL
ESTABL
1
3
4
10
1
17
73
1
1
1
2
2
2
118
FILLED
1
3
3
6
-
16
61
1
1
1
2
2
1
98
VACANT
-
1
4
1
1
12
-
-
-
-
-
1
20
3.1.2 AID PERSONNEL
A total of 5 US Peace Corps volunteer postings were attached to the Division during 1989, to help the
Rural Aquaculture Extension Programme, and one Japan volunteer (JOCV) assisted the RA&D statis-
tical unit. A Japan-funded engineering expert also assisted the refrigeration untl of the Teclutlcal services
section.
7

2.3 Page 13

▲back to top
Fisheries 1989 Annual Report
3.1 ADMINISTRATION
Several local staff (supernumery to the establishment) were supported by aid funds in specific projects.
The New.Zealand funded Seaweed Project employed three staff and the Australian funded Giant Clam
project employed four.
Of the established staff postings, the Principal Fisheries Officer (RA&D) salary was supplemented by the
British Government.
3.1.3 TRAINING RECEIVED
A total of15 staffmembers attended meetings, conferences or training courses overseas whilst 60 staffat-
tended training courses locally.
3.1.4 FINANCE
EXPENDITURE
The disbursement of funds is detailed below in Table 6. These figures are compiled from our internal led-
gers and still await reconciliation with Ministry headquarters accounts.
Table 6. FISHERIES DIVISION EXPENDITURE 1989
$810 242.16
$169 936.66
$289 636.33
$2 900 000.00
$154 764.02
Note: Capital expenditure by the Fiji Government included the construction of2 pole and line vessels for
Ika Corporation.
Operational expenditure (excluding capital works) was $1,269,814, a 12% increase on 1988. Total expen-
diture (including capital expenditure in 1989 and all aid-in-kind for 1988) was $4,717,533, a 24% decrease
on 1988.
REVENUE
Total revenue received for services in 1989 was $415,275.47 a 22% increase over 1988 due mainly to the
revitalisation of the rural fishermens training course which required the construction and sale of new ar-
tisanal fishing vessels.
Table 7. FISHERIES DIVISION REVENUE 1989
!Fish & Prawn sales
Pishiniz vessels - trainee
!Fishing vessels - commercial
IFishinl! !!ear
!Fishing licenses & re~stration
OCce sales
Sliowav etc fees
!Posters
rr'OTAL
$1110.00
$24.803.29
$55336.34
$57.775.84
$18.989.00
$253018.00
$1255.00
$2.988.00
$415275.47
3.1.5 VESSELS
A total of 13 powered vessels were used by the Fisheries Division. 5 of these were based in Lami, two each
in Savusavu and Makogai and one each in Lautoka, Labasa, Levuka and Taveuni. 11 of these are 28-foot
vessels constructed by the Division. Of the two larger vessels, the "Tui ni Wasabula" saw full use in re•
source assessment, training and extension cruises and the "Gonedau" was still undergoing extensive refit-
ting work, due for completion in February 1990. The Division's two other larger seagoing vessels have been
with the Auxiliary Unit of the Fiji Military Forces since 1987.
8

2.4 Page 14

▲back to top
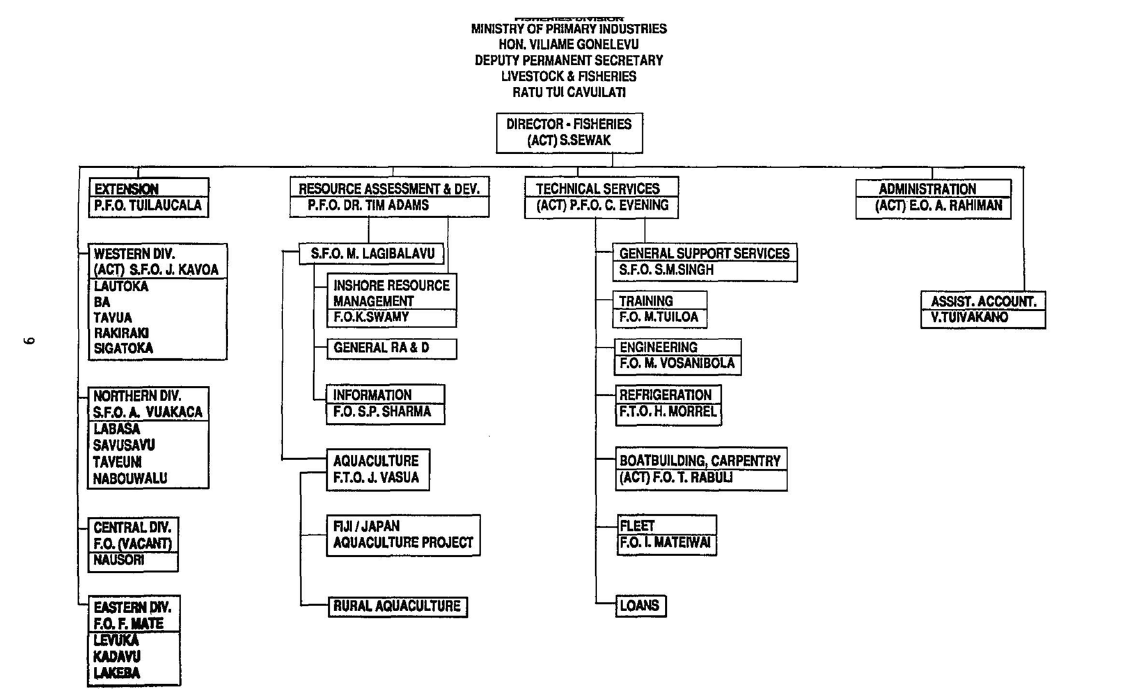
I
EXTENSION
P.F.O. TUILAUCALA
... WESTERN DIV.
(ACT) S.F.O. J. KAVOA
LAUTOKA
BA
TAVUA
RAKIRAKI
SIGATOKA
- NORTHERN DIV.
S.F.O. A. VUAKACA
LABASA
SAVUSAW
TAVEUNI
NABOUWALU
- CENTRAL DIV.
F.O. (VACANT)
NAUSORI
._ EASTERN PI\\I.
·~----F.O.F.IIATE
-·-·-·
KADAW
LME8A
&...»a »ILl"i:E..S Di G ISIUIQ
MINISTRY OF PRIMARY INDUSTRIES
HON. VIUAME GONELEVU
DEPUTY PERMANENT SECRETARY
LIVESTOCK & ASHERIES
RATU TUI CAVUILATI
DIRECTOR· ASHERIES
(ACT) S.SEWAK
I
RESOURCE ASSESSMENT & DEV.
P.F.O. DR. TIM ADAMS
I
rl S.F.O. M. LAGIBALAVU
- INSHORE RESOURCE
MANAGEMENT
F.O.K.SWAMY
H GENERAL RA & D
- INFORMATION
F.O. S.P. SHARMA
- AQUACULTURE
F.T.O. J. VASUA
I
TECHNICAL SERVICES
(ACT) P.F.O. C. EVENING
H GENERAL SUPPORT SERVICES
S.F.0. S.M.SINGH
H TRAINING I
F.O. M.TUILOA I
I H ENGINEERING
I
F.O. M. VOSANIBOLA
- REFRIGERATION
F.T.0. H. MORREL
- BOATBUILDING, CARPENTRY
(ACT) F.O. T. RABUU
- FIJI/JAPAN
AQUACULTURE PROJECT
- FLEET
F.0.1. MATEIWAI
7 RURAL AQUACULTURE I
LOANS I
I
ADMINISTRATION
(ACT) E.0, A. RAHIMAN
I ASSIST. ACCOUNT; I
I V.TUIVAKANO I

2.5 Page 15

▲back to top
Fisheries 1989 Annual Report
3.2 TECHNICAL SERVI~
3.1.6 VEHICLES
The Division utilized a fleet of32 vehicles. Of these, 19 vehicles were used in the Central Division, 4in~
Western and 9 in the Northern Division. Several new vehicles were purchased during the course ofU.
year to make up a longstanding shortfall. A major new acquisition was two mobile engineering works.ho.i:.
under the Japan-aided Rural & Artisanal Fisheries Project, which are deployed on.Vanua Levu and V'~
Levu to service iceplants and marine diesel engines. 3ofthe vehicles are non,functional and awaitingWriiii
off.
3.1.7 BUILDINGS, PLANTS AND OTHER FACILITIES
No major contruction works were carried out during 1989, apart from a tender to the GovernmentshiPi
ard to build 2 new pole and line vessels for Ika Corporation. Activity centred around the maintenance i:t
refurbishment of existing buildings, iceplants and vessels.
The main infrastructural priority for the Division is the construction of a commercial fishing port complca
at Lami to service the rapidly growing industrial tuna and deepwater snapper fleet operating out of tbl.
Central Division. Plans for this have been pending since 1978, and the situation has already reached criS4
levels. Several new or replacement iceplants are expected to be constructed in 1990, under the Japait
funded Rural and Artisanal Fisheries Project.
3.2 TECHNICAL SERVICES
3.2.1 BOAT BUILDING PROGRAMME
A total of 11 9-metre vessels were constructed in 1989, bringing the total number of such vessels con1
structed to 286 since the start of the programme in 1982. 8 were sold to rural trainees, whilst 1 was sold ,~
commercial fishermen and the remaining 2 vessels are earmarked for rural trainees. In addition, 2 1~
metre vessels were constructed for the rural development programme and a further 211-metre vessels ar4
being completed for private purchase. The boatbuilding program.me was held up at the beginning of 1981
due to escalating costs and the unavailability of the engines normally supplied under Japanese aid. Hoii
ever, the arrival of materials under the Japan Rural and Artisanal Fishing Project enabled the yard to r~
sume full-scale production in the last half of the year.
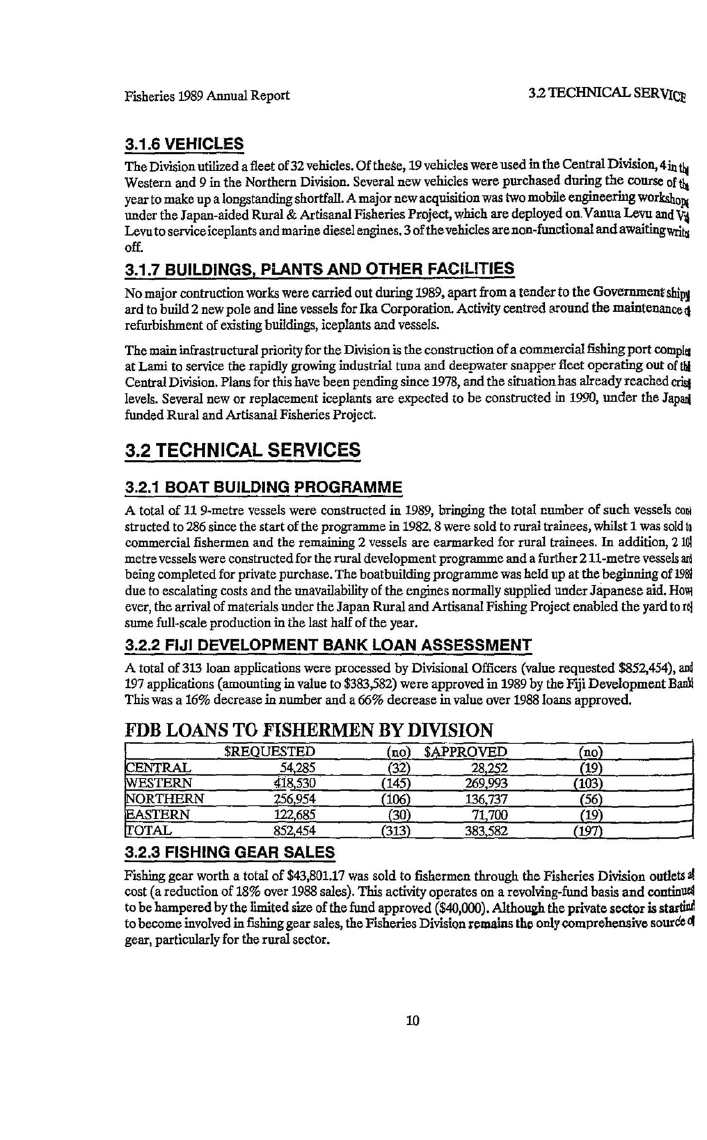
3.2.2 FIJI DEVELOPMENT BANK LOAN ASSESSMENT
A total of 313 loan applications were processed by Divisional Officers (value requested $852,454), and
197 applications (amounting in value to $383,582) were approved in 1989 by the Fiji Development Bam!
This was a 16% decrease in number and a 66% decrease in value over 1988 loans approved.
FDB LOANS TO FISHERMEN BY DMSION
OTAL
$REQUESTED
54285
122685
852454
$ PROVED
28252
269993
136737
71700
383582
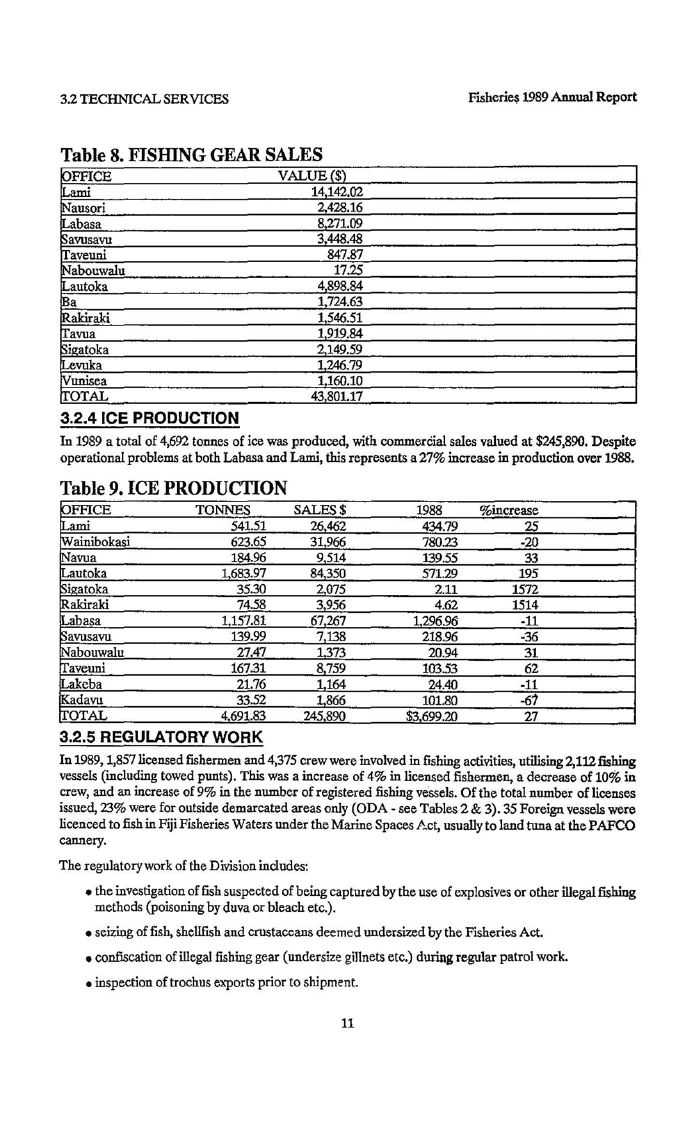
3.2.3 FISHING GEAR SALES
Fishing gear worth a total of $43,801.17 was sold to fishermen through the Fisheries Division outlets~
cost (a reduction of 18% over 1988 sales). This activity operates on a revolving-fund basis and contin~
to be hampered by the limited size of the fund approved ($40,000). Althouah the private sector is startiiUl
to become involved in fishing gear sales, the Fisheries Division r~mains the only comprehensive source~
gear, particularly for the rural sector.
10

2.6 Page 16

▲back to top
3.2 TECHNICAL SERVICES
Fisherie$ 1989 Annual Report
Table 8. FISHING GEAR SALES
OFFICE
La.mi
INausori
Labasa
Savusavu
Taveuni
Nabouwalu
ILautoka
IBa
IRakiraki
travua
Sfo:atoka
Levuka
IVunisea
!TOTAL
VALUE($)
14.142.02
2.428.16
8,271.09
3,448.48
847.87
17.25
4,898.84
1,724.63
1,546.51
191.9.84
2149.59
1246.79
1,160.10
43801.17
3.2.4 ICE PRODUCTION
In 1989 a total of 4,692 tonnes of ice was produced, with commercial sales valued at $245,890. Despite
operational problems at both Labasa and Lami, this represents a 27% increase in production over 1988.
Table 9. ICE PRODUCTION
IOFF1CE
ILami
1Wainibokasi
INavua
ILautoka
Sis:l:atoka
IRakiraki
Labasa
Savusavu
Nabouwalu
Taveuni
... akeba
Kadavu
TOTAL
TONNES
541.51
623.65
184.96
1683.97
35.30
74.58
1157.81
139.99
27.47
167.31
21.76
33.52
4.691.83
SALES$
26462
31966
9.514
84.350
2.075
3,956
67267
7,138
1.373
8.759
1,164
1.866
245.890
1988
434.79
780.23
139.55
571.29
2.11
4.62
1.296.96
218.96
20.94
103.53
24.40
101.80
$3699.20
%increase
25
-20
33
195
1572
1514
-11
-36
31
62
-11
-61
27
3.2.5 REGULATORY WORK
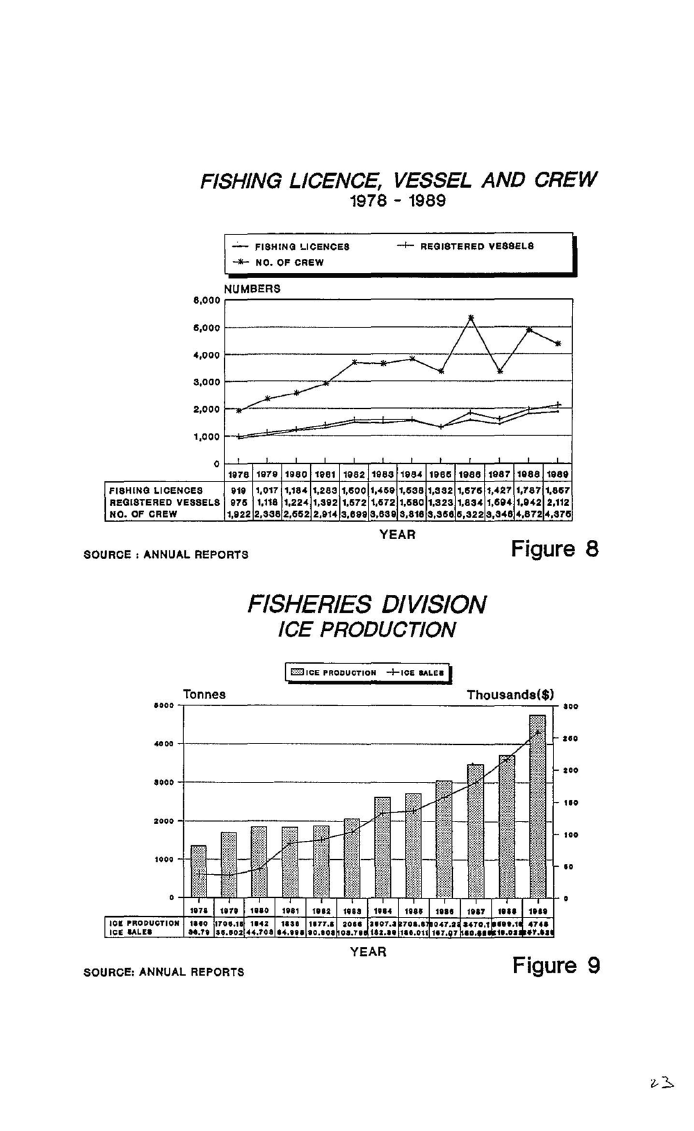
In 1989, 1,857 licensed fishermen and 4,375 crew were involved in fishing activities, utilising 2,112 fishing
vessels (including towed punts). This was a increase of 4% in licensed fishermen, a decrease of 10% in
crew, and an increase of 9% in the number of registered fishing vessels. Of the total number of licenses
issued, 23% were for outside demarcated areas only (ODA - see Tables 2 & 3). 35 Foreign vessels were
licenced to fish in Fiji Fisheries Waters under the Marine Spaces Act, usually to land tuna at the PAFCO
cannery.
The regulatory work of the Division includes:
• the investigation of fish suspected of being captured by the use of explosives or other illegal fishing
methods (poisoning by duva or bleach etc.).
• seizing of fish, shellfish and crustaceans deemed undersized by the Fisheries Act.
• confiscation of illegal fishing gear (undersize gillnets etc.) during regular patrol work.
• inspection of trochus exports prior to shipment.
11

2.7 Page 17

▲back to top
Fisheries 1989 Annual Report
3.3 EXTENSION SERVICES
• issue of export licenses.
• collection of detailed catch records for export shipments of aquarium fish and ornamental coral.
This is soon to be extended to all inshore resources coveredby the Cabinet- approved exploitation
guidelines and the forthcoming Fisheries Amendment Regulations.
3.2.6 FOOD PROCESSING UNIT
The Fisheries Division continued to provide assistance to rural communities in the production of salted
mullet and beche-de-mer through visits and on-site instruction. Several courses were held in collabora-
tion with the Auxiliary Unit of the Fiji Military Forces to train youth groups in the processing ofbeche-
de-mer.
Several Fishing Groups were assisted, and the finished product handled on behalf of the groups in some
cases.
3.2.7 TRAINING GIVEN
16 rural fishermen received training at one +month live-in course held at Lamj during the year, bringing
to 157 the total number of trainees on the programme since 1981. This training programme was held up
pending the aquisition of engines and gear for the 28-foot boats which are discounted to the trainees at
the end of each course.
The Division, in collaboration with FAO, also ran a 5-day seaweed cultivation workshop involving sea-
weed farmers from Fiji and several other regional countries, in November.
2 fisheries officers from the SolomonIslands Government were attachedto theRA&D section for 2 weeks
oftraining in market survey methods.
One Fiji fish-processing unit staff member went to Vanuatu to train loc;tl people in beche-de-mer pro-
cessing, and the Clam Project Officer visited Tonga to set up a giant clam hatchery there.
3.3 EXTENSION SERVICES
The ExtensionSection continued to provide the link between the Fisheries Division and the fishermen.
As well as their role in mediation, and the transfer oftechnology to fishermen, the 40 staff (spread over
14 stations) were fully involved in licensing and regulatory activities, ice and gear sales, loan processing,
fish processing, advisory services and lectures, and practical demonstrations to school and fishing groups.
3.4 RESOURCE ASSESSMENT AND DEVELOPMENT
3.4.1 COLLECTION OF PRODUCTION DATA
Municipal markets were surveyed at least sixdays per month (always including the highest volume day of
the week) and the sampling was applied to market~masters records to obtain a complete summary. Road-
side outlets were covered in depth at least once a month, and all other outlets quarterly. A system of con-
fidentiallogbooks for the recording ofpurchases bythese outlets was instituted in 1987, butthishas proved
oflimited value due to the low percentage of completed returns.
The purchases/sales by species, weight and, ifpossible, price form the production estimates for the arti-
sanal sector, and are detailed in the Appendices.
Staff shortages may force a reduction in statistical coverage of the fisheries sector in 1990. This is much
to be regretted since this production data is the basis for the formulation of fisheries policy and govern-
ment economic strategy, as well as providing an early warning on problems in the fishery.
12

2.8 Page 18

▲back to top
3.4 RESOURCE ASSESSMENT AND DEVELOPMENT
Fisheries 1989 Annual Report
3.4.2 BAITFISH AND TUNA CATCH STATISTICS
Catch statistics, supplied on standard forms by Ika pole and line and other industrial vessels, are analyzed
monthly and cross- referenced to PAFCO landings. Information summaries are set to SPC for inclusion
in the regional tuna stock-assessment programme.
Difficultywas experienced in obtaining complete catch-return coverage from some foreign vessels, either
due to poor understanding ofEnglish or through ignorance of the law. Attempts will be made to secure
historical returns before the new licencing season, and renewal of licences may be made condiqonal on
the provision of outstanding returns. Catch and effort returns from the developing domestic tuna longline
fishery were not forthcoming in most cases, but the new offshore licencing system (to be implemented iii
March, 1990) will make this a mandatory requirement for all tuna and deepwater snapper vessels regis•
tered under the Fisheries Act.
Catch statistics are essential for the Fisheries Division (in collaboration with SPC) to determine the size
oftuna stocks and fishing pressure, and hence to deploy fleets to the optimum advantage. In addition, rhe
provision ofcatch returns for tuna, which are highly migratory species and a regional resource, are one of
Fiji's obligations under the United Nations Law of the Sea Convention.
3.4.3 FISHERY RESOURCE MANAGEMENT
In addition to tuna, detailed catch/production data were obtained on aquarium fish, ornamental coral and
deepwater snapper, andtheharvest ofsedentaryresources vulnerable to over-exploitation (e.g. giant clam,
black coral, trochus, beche-de-mer) is monitored. Resource profiles and a fish commodity profile have
been produced to assist planners and investors, but these are in urgent need ofupdating. Legislation ban-
ning the export of Giant Clam meat, Dairo (Metriatyla scabra), and any beche-de-mer under 3" in length,
was introduced at the beginning of 1989 in an attempt to halt runawayexploitation ofthese resources, and
a Beche-de-mer exporters Association was set up to encourage a more responsible attitude amongst ex-
porters. The Fisheries Division will not issue export licences for Beche-de-mer to persons who are not
members of this association.
Fisheries Division efforts in 1990 will be directed at rationalisating the exploitation of sed~ntary inshore
resources which, in many cases, are showing signs ofstress. For most of these resources, exploitation can
be controlled most effectively at the export stage and such mechanisms as exporters associations and re-
stricting the number of export licences will be explored. At the moment, ornamental coral exports are
limited to one licenced company and live (aquarium) fish exports are limited to three.
Stock assessment work on trochus, pearl shell, beche-de-mer, mangrove crab and freshwater clam (kai)
is urgently needed, and these projects will either be initiated or followed up in 1990.
3.4.4 COASTAL ZONE MANAGEMENT
Fisheries assessments of proposed foreshore reclamations are routinely carried out. 10 applications (to-
talling 191 hectares) were recieved in 1989, resource value surveys performed, and cases heard by the in-
dependent arbitrator. 5 of these applications were in the Central Division, mainly for civic and industrial
purposes, and the 5 applications lodged for the Western Division (totalling 168ha) were mainly for tour-
ism development.
During the year 3 complaints ofillegal reclamationwere investigated andreferred to the proper authority.
5 cases of 'fish-kill' were reported during the year. Fisheries investigated these wherever possible and sent
water and fish samples to.independent laboratories for analysis. One perennial problem that keeps recur-
ring appears to be associated with the cleaning of sugar mills after the crushing season.
3.4.5 FAD DEPLOYMENT
No Fish Aggregating Devices were deployed by the Fisheries Division during 1989 due to the unavaila-
bility of funding. However, Ika Corporation's FAD programme deployed 14 FAD's for use by pole and
13

2.9 Page 19

▲back to top
Fisheries 1989 Annual Report
3.4 RESOURCE ASSESSMENT AND DEVELOPMENT
line vessels (financed by a levy on tuna landings of $5 in the tonne), and the Filipino purse seiner char-
tered by PAFCO deployed over 70 FAD's around the EEZ (well offshore) in the earlypart of the year.
Followupwork on theFAD's that theDivisiondeployed near Suvaand Savusavuin1988showed that some
of the devices were yielding extremely good catches, and that certain sectors of the fishing community
have come to rely on them. The deployment programme will be resumed in 1990 as these devices are very
valuable in diverting fishermen away from overstressed lagoon fisheries, and in supplementing reduced
supplies of fish to urban markets. Although it may be coincidental, due to the low frequency oftropical
cyclones recently experienced, the average lifetime of the FAD's deployed in 1987 and 1988 appears to
be around 18 months:- a marked improvement on previous experience, bearing in mind that an individ-
ual FAD can cost from $3-4,000.
A desirable option for the future is the formation of a dedicated team, with vessel, to maintain a continu-
ous programme of FAD deployment and maintenance, for the benefit of both tuna and artisanal fisher-
men, but an institutional mechanism for this has yet to be developed.
3.4.6 DEEPWATER SNAPPER
The semi-industrial fishery for deepwater snapper lost momentum in 1989 due to the diversion of effort
into Ionglining for the larger tunas. The management plan for deepwater snapper was formalised and a
new limited-entrylicencing system will be in place in 1990, allowing for catch-quotas, preference to local
and small-scale fishermen, restricted areas, and a legal requirement for fishermen to supplycatch-returns.
This licencing system will also apply to the tuna fishery, mainly as a pre-emptive measure to protect the
future interests ofFiji fishermen in the face oflarge-scale foreign interest, but also to legally mandate the
supplyofcatch returns from all domestic tuna fishing vessels. The domestic longline fishery has expanded
rapidlyover the past 2 years and, byDecember 1989, there were atleast 30 vessels over 12metres inlength
licenced or approved to fish for deepwatersnapper and/or tuna, and aiming at the chilled-fish export mar-
ket. The Fisheries Division is very aware of the fact that all of these vessels would want to fall back on the
deepwater snapper fishery if there was a downturn in sashimi tuna export prospects.
Statistics resulting from catch returns will be collated and used to refme estimates ofmaximum allowable
fishing pressure, in conjunction with length-frequency samples and scientific observer placements on
board a sample ofvessels.
3.4.7 GIANT CLAM PROJECT
The FijiModule ofthe International Giant Clam Project is executed by the Fisheries Division in collabor-
ation with the James CookUniversity of North Queensland, and funded by the Australian Centre for In-
ternational Research. The Project started in 1984and the first phase accomplished a massive field survey
ofgiant clam stocks in Fiji waters, together with setting up a quarantine station and re-introducing the re-
cently-extinct Tridacna gigas to Fiji.
Phase 2 of the project officially started in July, 1989, and is due to run until mid-1992. This phase of the
project will concentrate on developing Giant Clam aquaculture under Fiji conditions, initiating reef-re-
seedingtrials and exploring the possibilities ofcommercial clam-farming.1989 saw the setting-up ofa full-
scale, but low-technology, hatchery on Makogai island in Lomaiviti, and the project performed the first
successful mass-culture of giant clams in Fiji early in 1989.
Results have beenvariable, as are expected from a new activity, but the Project now has several thousand
juvenile Tridacna derasa and T.squomosa available to refine the reef-growout cycle. An output of100,000
seed-clams will be aimed for in 1990, which will enable work to be started onvillage-level extension trials
using experience gained from observing a similar programme in the Solomon Islands. Commercial farm-
ingtrials will be explored in 1991 and it is hoped that the hatchery will be self-supporting through the sale
of seed clams by the time the project finishes in 1992.
Giant clam farming, or reef-reseeding, is not expected to be a panacea for Fiji's overfished natural giant
clam stocks. Giant clam farming, whilst promising, is not yet proven commercially viable anywhere in the
world, and commercial farms will take at least 3-4 years to obtain the first fruits of production. Reef- re-
14

2.10 Page 20

▲back to top
3.4 RESOURCE ASSESSMENT AND DEVELOPMENT
Fisheries 1989 Annual Report
seeding, as a public service, will only be economically possible over very small areas and then only if the
reefs can be protected from fishermen. It is expected that the main work of restocking reefs will be left to
the clams themselves, under the protection that was afforded by the 10-year ban on exports of giant clam
meat that was introduced in December 1988. The project will continue to monitor natural regeneration
in these stocks, and to reseed "starter" stocks to those reefs which were depleted beyond their ability to
regenerate.
3.4.8 SEAWEED CULTURE
Fiji has been developing Eucheuma "cottonii" seaweed cultivation since 1985. This fast-growing red algal
species is cultivated on otherwise unproductive back-reefflats, and the sun-dried weed is dried for export
and processing into carageenan, which is a food additive much in demand for stabilizing milk products
such as ice-cream and yoghourt.
After severe setbacks in 1988, following the withdrawal of the seaweed development company, Coast Bi-
ologicals (Fiji) Ltd, the Fiji eucheuma growing industry was in a precarious position and many rural con-
tract farmers lost confidence. However, world market prices showed an upward trend, and the Fisheries
Division decided to support the industry through this difficult period since it appeared to be a good ve-
hicle for rural development. A seaweed farmer can expect 3-4 crops per year with yields of up to 10 ton-
nes of dry weed per acre, and startup capital is minimal if the growing site is favourable.
Throughout 1989, the Fisheries Division, in collaboration with the National Marketing Authority of Fiji,
found export markets; collected, graded and packed the weed from rural farmers, and exported the final
product. In tandem, a grant from the New Zealand Overseas Development Administration enabled the
Division to employ 3 seaweed project staff to encourage and advise farmers, and to supply small equip-
ment grants to farmers. New private-sector participation was solicited, and in 1989 a new company, Sea-
weed (South Pacific) Ltdwas formed, operating out ofVanuaLevu. S(SP) Ltdwill be in a position to take
over export marketing from contract farmers early in 1990, leaving the Fisheries Division free to concen-
trate on development work: extension advice, site surveys, trials on new culture methods and seaweed
species.
By the end of1989, the farm-gate buying price had been raised by40% on the January price, and seaweed
farming looks set once more for a phase of rapid expansion.
3.4.9 FRESHWATER FISHERIES
Verylittle work was carried out inthe field offreshwater fisheries in 1989 due to the lack of suitably quali-
fied staff, apartfrom routine monitoringofthe impoundment at Vaturuwhichwas previouslystockedwith
carp and black bass as the potentialbasis for a tourist angling industry. However, in 1990 the Fisheries Di-
vision will have to investigate the reasons behind the drop in lcai (freshwater clam, Batissa violacea) sup•
plies to domestic markets. Kai is the major freshwater fisheries product in Fiji and also the major compo-
nent of Fiji's total mollusc production. As mentioned earlier in this report, the dredging work being car-
ried out in the Rewa river may be a significant factor in disturbing the kai beds, and it is to be hoped that
this disturbancewill be temporary. Kaiis a major protein source for lower-income Fijians, especiallyrural
inland people.
3.4.10 MACROBRACHIUM CULTURE
Hatchery production of 1 million post-larvae per year, with yields of up to 1.2 tonnes/ha/yr, has been
achieved at the Naduruloulou hatchery. Growout trials are continuing,and a start wasmade on prawn/fish
polyculture trials, with very promising results.
3.4.11 PRODUCTION OF MAJOR CARPS
Induced spawning of 3 carp species has been achieved, and the river weed-control proaramme, usilli
grass carp, continues to be a great success. Attention is now moving to Western Division rivers, although
the weed problem here involves water-hyacinth and may be a little more difficult to.control.
Grass carp is proving to be a popular table fish amongst inland rural peoples (despite the bones), and the
weed-control programme is experiencing difficulties due to overfishing of the grass-carp stocked into ri-
15

3 Pages 21-30

▲back to top

3.1 Page 21

▲back to top
Fisheries 1989 Annual Report
3.5 INFORMATION AND LIBRARY SERVICES
vers. Although there is a long-standing legal prohibition oh using gillnets in fresh water, enforcement of
the law in inland areas is difficult since fisheries officers are coastally based. The only long term solution
to the problem is to improve fish-supplies in inland areas, and this is one of the major aims of the Rural
Aquaculture Programme.
3.4.12 RED TILAPIA CULTURE
Experimental trials, in collaboration with a commercial farmer, are continuing, and the first commercial
sales from the pilot- farm •vere made at the end of1987, with very good results. However, the experimen-
tal sale of small quantities of normally- coloured tilapia in 1989 showed equally promising results. Tan-
dem trials will be continued to see ifbetter consumer acceptance or better growth characteristics mitigate
the difficulty of maintaining genetically pure red-strain tilapia.
3.4.13 RURAL AQUACULTURE.PROGRAMME
US Peace Corps volunteers continue to facilitate the development of village ponds for the production of
Tilapia Most ofthe ponds (14,000 squaremetres total pond area) were concentrated inEasternViti Levu
during the first stage of the programme, but in 1989 advisory support was substantially expanded in the
Northern Division.
The main aim ofthis programme initiallywas to improve protein nutrition in inland areas, by encouraging
subsistence and communalfish ponds. However, experiencehas shown thata more commercially-oriented
approachyieldsbetter resultsinterms ofsustained activity. More supportwillbegivento the establishment
ofprofit-making fish farming in future. Motivation is of prime importance in helping fish farming in Fiji
to become self-sustaining.
The Fisheries Division's Naduruloulou Aquaculture Research Station has the capacity to expand tilapia
fingerling production to cater for demand from rural farmers for some time to come, but some farmers
will be encouraged to specialise in fry production against the day when private sector demand outstrips
public sector supply.
The rural aquaculture programme will also explore ways of introducing Fisheries and Agriculture exten-
sionofficers to fish- farming, to increase the generallevel oflocal expert advice. Governmentis very aware
that reef-fish resources cannot continue to supply the current level of human population growth in Fij~
particularly in the face of increasing exports, and the development of aquaculture is part of a long-term
strategy to maintain local fish supplies.
3.5 INFORMATION AND LIBRARY SERVICES
A wide range of books, periodicals and publications on relevant topics were made available to Fisheries
staff, USP students and interested people through the Fisheries Division Library, and the branch libraries
set up in Lautoka and Labasa continued to serve the public. Monthly news bulletins, research reports,
radio broadcasts and newspaper supplements were produced to enhance public awareness of the fishery
sector and support extension activity.
There has been a recent trend towards including certain aspects ofFisheries in the Fiji school curriculum,
and the Division gave many lectures to schools around the country during 1989.However, staffconstraints
mean that this sort of activity cannot be extended to all the schools that request it. Efforts will be made,
in collaboration with the Ministry ofEducation, to produce a standard schools information pack to cover
the topics that might be raised in the curriculum during the year.
Unfortunately, information unit staff levels declined to zero, with the continued vacancy in the Graphic
Design post, the secondment ofthe Information Assistant for 12 months training in agricultural journal-
ism, and the resignation of the Library Assistant.
16

3.2 Page 22

▲back to top
3.6 INTERNATIONAL LINKAGES
Fisheries 1989 Annual Report
3.6 INTERNATIONAL LINKAGES
The small island countries of the South Pacific derive considerable benefit from the pooling of fisheries
advisory services through regional organisations such as the Forum Fisheries Agency and the South Pa-
cific Commission, and Fij~ although possessing one of the most developed fisheries sectors in the South
Pacific, oftenhas to draw onthis expertise. In addition. all countries signatory to the United Nations Law
of the Sea Convention are obliged to cooperate in the management of highly migratory species, such as
tuna. Regional tuna management is facilitated through the scientificservices ofthe SPC, to whichFiji con-
tributes data on the tuna catch in Fiji waters, and through the fishing fleet access and treaty functions of
theFFA.
The Fisheries Division activelyparticipatedin a range ofregional activities during 1989,including the for-
mulation ofthe Convention for the Prohibition ofFishing with LongDriftnets in the South Pacific inWell-
-ington.
Other meetings included the 21st SPC Technical meeting, the 16th and 17th sessions of the Forum Fish-
eries Committee and the Standing Committee of the SPC's Tuna and Billfish Assessment Programme as
well as the second meeting of the South Pacific Albacore Research Group (SPAR). Regular contact is
maintained with all regional fisheries organizations, including SPC, FFA, Forum Secretariat and the
UNDP Regional Fisheries Programme, and with several international organisations, including INFOF-
ISH andIUCN. Activeparticipationin international organisations, such as FAO, is maintained at a higher
level within the Ministry.
Programmes of technical cooperation, collaboration, or assistance are maintained with the Governments
ofJapan, Australia, New Zealand, United Kingdom and USA, although these vary from year to year, and
expert assistanceis lent to other countries Qfthe region on request. Divisional resource specialists include
expertise in giant clam culture, beche-de-mer processing, tilapia aquaculture, prawn and shrimp hatchery
techniques, Eucheuma seaweed farming, marine resource surveys, local market monitoring and artisanal
fisheries training.
Fiji has no formal access agreements with any Distant Water FishingNations apart from the USA (under
theUS/Forummultilateral treaty) at present, butis stronglysupportingregional effortstointroduce multi-
lateral access agreements with Japan and otherAsian nations. However, the Fisheries Division currently
licences several foreign vessels on an individual basis, particularly with Taiwan, provided that they land
fish at a Fiji port and sell to a Fiji company.
17

3.3 Page 23

▲back to top
Fisheries 1989 Annual Report
3.6 INTERNATIONAL LINKAGES
LIST OF APPENDIX FIGURES
Figure 1
Figure 2
F'igure3
Figure 4
Figure 5
Figure6
Figure?
Figure 8
Figure9
Figure 10
Domestic commercial fish production 1978-89
Domestic commercial non.fish production 1978-89
Total domestic fish supply 1978-1989
Total catch from Fiji waters 1978-1989
Domestic Marketing Structure 1978 vs 1989
Domestic Fishery production as GDP
External Fisheries trade balance
F'1Shlng Licences, vessels & crew 1978-1989
Ice production by Fisheries Division 1978-1989
Consumption per head
LIST OF APPENDIX TABLES
Table 1
Unloading quantity by boat (PAFCO)
Table2
Unloading quantity by species (PAFCO)
Table3a
Glossary of Fijian food fish names
Table3b
Glossary of Fijian non-fish names
Table4
Price of fish at municipal markets
TableS
Price of non-fish at municipal markets
Table6
Volume of fish at municipal markets
Table7
Volume of non-fish at municipal markets
Table8
Fish sales by Division
Table9
Non-fish sales by Division
Table 10
Fish volume at other outlets
Table 11
Non-fish volume at other outlets
Table12
Summary of domestic commercial sales
Table13
Exports
Table 14
Re-exports
Table 15Imports
18

3.4 Page 24

▲back to top
DOMESTIC COMMERCIAL FISH PRODUCTION
1978 - 1989
[IT] Other Outlets B M.Markets -a- Average Price
Tonnes
$/Kg
5,000 , - - - - - - - - - - - - - - - - - - - - - - - , $3.5Kg
4,000 ~ - - -- - - - - - -
$3Kg
2,000
i11-:::::
1,000
!~ i i ::~
0
1978 1979 1980 1981 1982 1983 1984 1985 1986 1987 1988 1989
YEAR
Other Outlet (shops,restaurants,cafes,
supermarkets,hotels and butchers).
M.Markets means (mun.lclpal markets)
Figure 1
DOMESTIC COMMERCIAL NONFISH PRODUCTION
1978 - 1989
EkJ Other Outlets • M.MARKET· -a- Average price
Tonnes
$/Kg
2,500 , - - - - - - - - - - - - - - - - - - - - - - ~ $2.5Kg
1,500 t---------fr,
$2Kg
$1.5Kg
1,000
$1Kg
600
0
1978 1979 1980 1981
Other Outleta(ahops,restauranta,cafes,
supermarkets,hotels and butchers).
M.Markets means (munlclpal markets)
Figure 2

3.5 Page 25

▲back to top
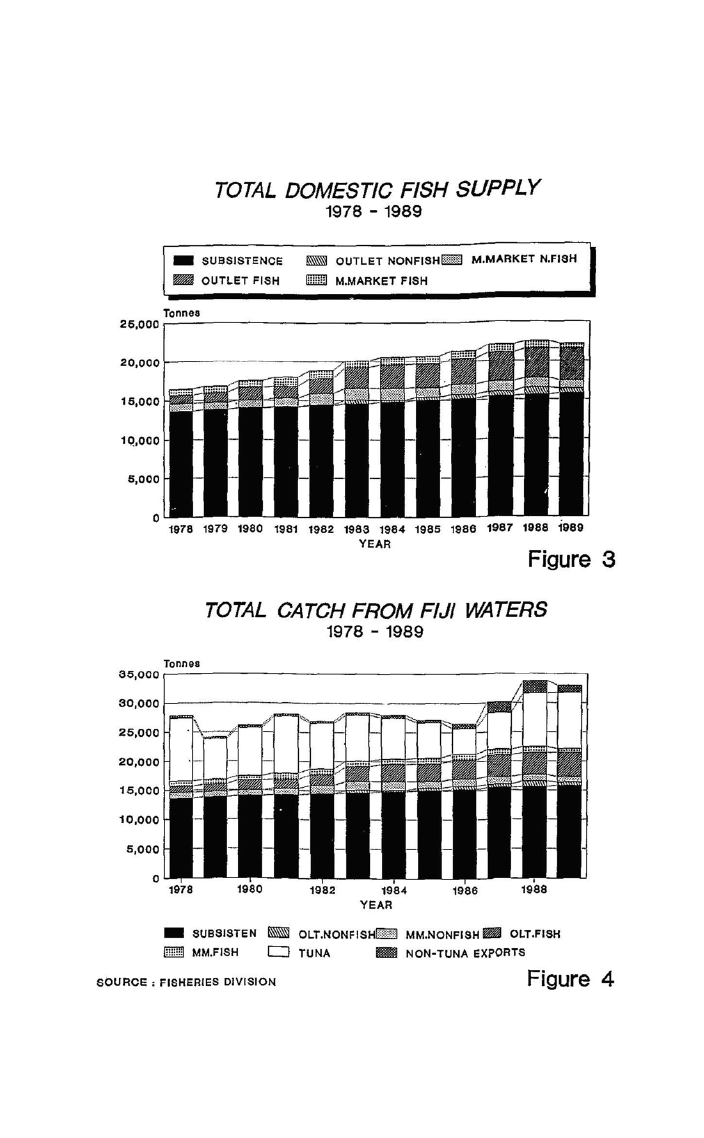
TOTAL DOMESTIC FISH SUPPLY
1978 - 1989
- SUBSISTENCE
B OUTLET FISH
- OUTLET NONFISHIIJ.II M,MARKET N.FISH
llmm1 M.MARKET FISH
15,000
1Q,OOO
5,000
0
1978 1979 1980 1981 1982 1983 1984 1985 1986 1987 1988 1989
YEAR
Figure 3
TOTAL CATCH FROM FIJI WATERS
1978 - 1989
Tonnes
35,000 , - - - - - - - - - - - - - - - - - - - -- - - - - . . .
25,000
20,000
10,000
5,000
0
1978
1980
- SUBSISTEN B
ffiTIIBI MM.FISH O
SOURCE : FISHERIES DIVISION
1982
1984
YEAR
1986
1988
OLT.NONFISHh;::c:;':::) MM,NONFISH 8 OLT,FISH
TUNA
illl!IIII NON-TUNA EXPORTS
Figure 4

3.6 Page 26

▲back to top
DOMESTIC MARKETING STRUCTURE
1978
M.MAAKETS
50$
.......-.............---_....._.., .....-....---
- - - - - NONFISH
.\\\\\\\\\\\\\\\\\\\\\\\\\\\\\\\\\\\\\\\\\\\\\\\\\\\\\\\\\\\\\\\\
3%
OTHER OUTLETS
50$
FISH
97%
..... _------
M.MARKETS
16$
1989
..........-----.........---------------...---
OTHER OUTLETS
84$
---- ...... __ ........ --- ..
Other Outlets means (ahops,reataurants,
cafea,aupermarketa,hotels and butchers).
M.Marketa means (municipal markets)
NONFISH
13%
FISH
87%
Figure 5
ZI

3.7 Page 27

▲back to top
DOMESTIC FISHERY PRODUCTION AS GDP
1978 - 1988
I• I Value -s- % OF GDP
Value ($x1000)
% of GDP
1800 - , - - - - - - - - - - - - - - - - - - - - - ~ 1.4..
1.2..
1000
800
0.8%
800
0.4%
400
200
0.2%
0
O'l&
1978 1979 1980 1981 1982 1983 1984 1985 1986 1987 1988
YEAR
SOURCE : CURRENT ECONOMIC STATISTICS
Figure 6
FIJI'S EXTERNAL FISHERIES TRADE BALANCE
WITH TOP 13 COUNTRIES
(1989 VALUE)
_Trade Balance
- Import to FIJI
~ ~ Export from FIJ·1
Australia -
Canada -
China-Taiwan -
Hong Kong -
Italy -
Japan -
Korea(S) -
New Zealand -
Phlllplne -
Singapore -
-L--L--~~===c~::::r:_J ThailaUnKd --
usA
_., ......,,..,,,::,,,,,,..,:.=:Y:.,·:·,·::::,=:=:::,..,.,--,:,,,,,,,,,.·::-:::,=,·
-$20
-$10
aouRce, euReAu oF sTAT1sT1cs Import
$0
$10
$20
Millions Export Figure 7

3.8 Page 28

▲back to top
FISHING LICENCE, VESSEL AND CREW
1978 - 1989
FISHING '..ICENCES
-i1f- NO. OF CREW
-+- REGISTERED VESSELS
NUMBERS
8,000
15,000
4,000
..
3,000
2,000
/
~
~
1,000
If.
I\\ ~
- =~ V
__....-:--
~
0
I
1
1
I
I
1
I
I
I
I
I
11178 1979 1980 1981 1982 1983 1984 19815 1988 1987 11188 1989
FISHING LICENCES
1119 1,017 1,184 1,283 1,1500 1,41511 1,1538 1,332 1,15715 1,<427 1,787 1,8157
REGISTERED VESSELS 9715 1,118 1,22• 1,592 1,1572 1,1572 1,1580 1,323 1,834 1,159<4 1,9<42 2,112
NO. OF CREW
1,1122 2,538 2,1552 2,IIU 3,8119 3,839 3,818 3,3158 5,322 S,348 4,872 <4,3715
SOURCE: ANNUAL REPORTS
YEAR
Figure 8
FISHERIES DIVISION
ICE PRODUCTION
I I m:i 1cE PRODUcT10N +1cE IALE
Tonnes
Thousands($)
1000 - . - - - - - - - - - - - - - - - - - - - - - - - - - - - - - . . . - 1 0 0
4000
, I >- 110
- aoo
1000 +-- ------- -- - -- -----
-::::::::::
.::::::::•
- 1'0
2000 -;---------- ---f::ili~.."!
---- 7
- 100
1000 -
- 10
;3;;~\\.;~::
0-+-'=1r"--r-'"-T"L-r-..._,1.~r-"T"--r-'-'-'r.._,.-=,..._,.,....,'-'f'-'.....,_.-=,,=-,-1'~1"'--,,--"'~,"'--,-"",1;=.-,-J~,=..,+o
1971 191' 1810 1981 1982 1988 1U4 198' 1811 1987 IHI 1HI
IICf. PRODUCTION 1HO 17Dt.11 1142 11U 1177,1 200I U07.ll 1701,I ,047.a 1470,1 UH,U 414t
ICE IIALEI
H.78 H ,102 44,701 14,111 ID.lot 01.TII tU,11 111.011 1'7,07 ~ID.HI ll,Dll ..7,UI
SOURCE: ANNUAL REPORTS
YEAR
Figure 9

3.9 Page 29

▲back to top
CONSUMPTION PER HEAD
1978 - 1989
B SUBSISTENCE
- 9 - FISH($)
- FJSH
-+- NONFISH($)
k}/! NONFISH
IIIIIlill IMPORT
$/HEAD
40Kg
$20
30Kg
$15
20Kg
$10
$5
0Kg
$0
1978 1979 1980 1981 1982 1983 1984 1985 1986 1987 1988 1989
SOURCE: CENSUS, ANNUAL REPORTS
YEAR
Figure 10

3.10 Page 30

▲back to top
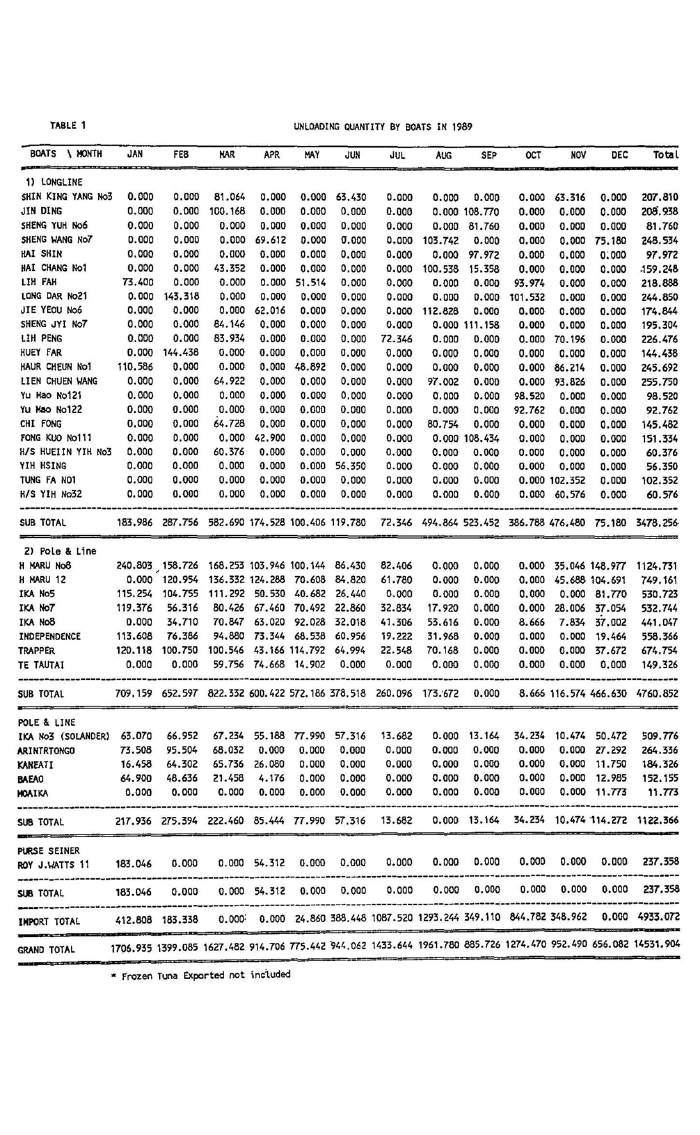
TABLE 1
UNLOADING QUANTITY BY BOATS IN 1989
BOATS \\ MONTH JAN
FEB
W.R
APR MAY JUN
JUL
AUG
SEP
OCT
NOV DEC Total
1) LONGLINE
SHIN KING YANG No3 0.000 0,000 81.064 0.000 0.000 63.430 0.000 0.000 0.000 0.000 63.316 0,000 207.810
JIN DING
0.000 0.000 100. 168 0.000 0.000 a.ooo o.oao o.ooD 108.no 0.000 0.000 0.000 208. 't38
SHENG YUH No6
0.000 0.000 0.000 0.000 0.000 0.000 0.000 0,000 81.760 0.000 0.000 0.000 81.760
SHENG WANG No7
IIAI SHIN
0.000 0.000 0.000 69.612 0.000 0.000 0,000 103.742 0.000 0.000 0.000 75.180 248.534
0.000 0,000 0.000 0.000 0.000 0,000 0.000 0.000 97.972 0.000 0.000 o;ooo 97.972
HAI CHANG Nol
LIH FAH
LONG DAR No21
JIE YEOU No6
SHENG JYI No7
0.000
73,400
0.000
0.000
0.000
0.000
0.000
143,318
0.000
0.000
43.352
0.000
0.000
0,000
84.146
0.000
0.000
0.000
62.016
0.000
0.000
51.514
0,000
0.000
0.000
0.000
0.000
0.000
0.000
0.000
0.000
0.000
0.000
0.000
0.000
100.538 15.358
0.000 0,000
0.000 0.000
112.828 0.000
0.000 111.158
0.000
93.974
l01.532
0,000
0.000
0.000
0.000
0.000
0.000
0.000
0.000
0.000
0.000
0.000
0.000
-159. 248
218.888
244.850
174.844
195.304
LlH PENG
0.000 0.000 83.934 0.000 0.000 0.000 72.346 0.000 0.000 0.000 70.196 0.000 226.476
HUEY FAR
0.000 144.438 0.000 0.000 0.000 0.000 0.000 0.000 0.000 0.000 0.000 0.000 144.438
HAUR CHEUN No1 110.586 0.000 0.000 0.000 48.892 0.000 0.000 0.000 0.000 0.000 86.214 0.000 245.692
LIEN CHUEN WANG
Yu Hao No121
0.000 0.000 64.922 0.000 0.000 0.000 0.000 97.002 0.000 0.000 93.826 0.000 255.750
0.000 0.000 0.000 0.000 0.000 0.000 a.coo 0.000 0.000 98.520 0.000 0.000 98.520
Yu Hao No122
0.000 0.000 0.000 0.000 0.000 0.000 0.000 0.000 0,000 92.762 0.000 0.000 92.762
CHI FONG
0.000 0.000 64.728 0.000 0.000 0,000 0.000 60,754 0.000 0.000 0.000 0.000 145.482
FONG KUO No111
0.000 0.000 0.000 42. 900 0.000 0.000 0.000 0.000 108.434 0.000 0.000 0.000 151.334
HIS HUEIIN YIH No3 0.000 0.000 60.376 0.000 0,000 0.000 0.000 0.000 0.000 0.000 0.000 0.000 60.376
YIH HSING
0.000 0.000 0.000 0.000 0.000 56.350 0.000 0.000 0.000 0.000 0,000 0.000 56.350
TUNG FA N01
0,000 0.000 0.000 0.000 0.000 0.000 0.000 0.000 0.000 0.000 102.352 0.000 102.352
HIS YIH No32
0.000 0.000 0.000 0.000 0.000 0.000 0.000 0.000 0.000 0.000 60,576 0.000 60.576
---------------------------------------------------------------------------------------------------------------------------------
SUB TOTAL
183.986 287.756 582.690 174.526 100.406 119.780 72.346 494.864 523.452 386.788 476,480 75.180 3478. 256
2) Pole & Line
H MARU No8
240.803 , 158. 726 168.253 103.946 100.144 86.430 82.406 0.000 0.000 0.000 35.046 148.9n 1124. 731
H W.RU 12
0.000 120.954 136.332 124.288 70.608 84.820 61.780 0.000 0.000 0.000 45.688 104.691 749.161
IKA No5
115. 254 104.755 111.292 50.530 40.682 26.440 0.000 0.000 0.000 0.000 0.000 81.no 530,723
IKA No7
119.376 56.316 80.426 67,460 70.492 22.860 32.834 17.920 0,000 0.000 28.006 37 .054 532.744
IKA No8
0.000 34.710 70.847 63,020 92. 028 32.018 41.306 53.616 0.000 8.666 7.834 37,002 441,047
INDEPENDENCE
113,608 76.386 94,880 73.344 68.538 60.956 19,222 31. 968 0.000 0.000 0.000 19.464 558.366
TRAPPER
120.118 100.750 100.546 43.166 114.792 64.994 22.548 70.168 0.000 0.000 0.000 37.672 674.754
TE TAUTAI
0,000 0.000 59.756 74.668 14.902 0.000 0.000 0.000 0.000 0.000 0.000 0.000 149.326
------------------~--------------------------------------------------------------------------------------------------·-----------
SUB TOTAL
709. 159 652.597 822.332 600.422 572. 186 378.518 260.096 173:672 0,000 8.666 116.574 466.630 4760.852
POLE & LINE
IKA No3 (SOLANDERl 63,070 66.952 67.234 55.188 n.990 57.316 13.682 0.000 13.164 34,234 10,474 50.472 509.TT6
ARINTRTONGO
73.508 95.504 68.032 0.000 0.000 0.000 0.000 0.000 0,000 0.000 0,000 27.292 264.336
KANEATI
16.458 64.302 65.736 26.080 0.000 0,000 0,000 0.000 0,000 0.000 0,000 11.750 184,326
BAEAO
64.900 48,636 21.458 4.176 0.000 0.000 0.000 0.000 0.000 0.000 0.000 12.985 152.155
l«lAIKA
0.000 0.000 0.000 0.000 0.000 0.000 0.000 0.000 0.000 0.000 0,000 11.m ,,.m
---------------------------------------------------------------------------------------------------------------------------------
SUB TOTAL
217,936 275.394 222.460 85.444 n.990 57.316 13.682 0.000 13.164 34.234 10.474114.272 1122,366
Pl.RSE SEINER
ROY J,\\.JATTS 11 183.046 0.000 0.000 54.312 0.000 0,000 0.000 0.000 0.000 0.000 0.000
----------------------------------------~---------------------------------------------- --
SU8 TOTAL
183.046 0.000 0.000 54.312 0.000 0.000 0.000 0.000 0.000 0.000 0.000
--------------~---------------------------------------------------------------- -
IMPORT TOTAL
412.808 163.338 0.000: 0.000 24,860 388.448 1087.520 1293.244 349.110 844,782 348.962
0.000 237.358
0.000 237.358
0,000 4933,072
GRANO TOTAL
1706,935 1399.085 1627.482 914.706 nS.442 ~44.062 1433.644 1961.780 885.726 1274.470 952.490 656.082 14531.904
* Frozen Tuna Exported not inci.uded

4 Pages 31-40

▲back to top

4.1 Page 31

▲back to top
TABLE 2
UNLOADING QUANTITY OF FISH BY SPECIES AT PAFCO:
YEAR: 1989
\\ MONTH
SPECIES \\
JAN
FEB
MAR APR MAY JUN
JUL
AUG
SEP
OCT
NOV DEC TOTAL
1Hong line
ALBACORE
144.824
YELLCWFIN
0.00D
BJGEYED TUNA 0.00D
BLUE HARLIN
0.000
BLACK I/ARLIN 0.000
S\\,QRO FISH
0.000
STRIPED HARLIN 0.000
SAlt FlSH
0.000
SPEAR FISH
0.000
WAHOO
0.000
HAHi HAHi
0.000
BLUE SHARK
0.000
SKIPJACK
1.816
OTHERS
37.346
239.996
0.000
0.000
0.000
0.000
0.000
0.000
0.000
0.000
0.000
0.000
0.000
4.200
43.560
432.274 112.716
0.000 0.000
0.000 0.000
0.000 0.000
0.000 0.000
0. 000 0.000
0.000 0.000
0.000 0.000
0. 000 0.000
0.000 0.000
0.000 0.000
0.000 0.000
9.696 3.350
140.720 58.462
55.646
0.000
0.000
0.000
0.000
0.000
0.000
0.000
0.000
0.000
0.000
0.000
1.096
43.664
91.764
0.000
0.000
0.000
0.000
0.000
0.000
0.000
0.000
0.000
0.000
0.000
0.202
27.814
35.388
0.000
0.000
0,000
0.000
0.000
0.000
.0.000
0.000
0.000
·o.ooo
0.000
0.160
36.798
398. 152 409. 534
0.000 0.000
0,000 0.000
0.000 0.000
0.000 0. 000
0.000 0.000
0.000 0.000
0.000 0. 000
0.000 0, 000
0.000 0.000
0.000 0.000
0.000 0.000
1. 644 111.876
95.068 2.042
354.414 325.782
0.000 0.000
0.000 0.000
0.000 0.000
0.000 0.000
0.000 0.000
0.000 0.000
0.000 0.000
0.000 0.000
0.000 0.000
0.000 0.000
0.000 0.000
0.280 2.680
32,094 148.020
45.788
0.000
0.000
0.000
0.000
0.000
0,000
0.000
0.000
0.000
0.000
0.000
0.304
29.088
2646,278
0.000
0.000
0.000
0.000
0.000
0.000
0.000
0.000
0.000
0.000
0.000
137.304
694.676
Sub Total 183.986 287.756 582,-690 174.528 100.406 119,78D 72.346 494.864 523.452 386.788 476.482 75.180 3478.258
2)Pole & Line
ALBACORE
0.000
YELLOrlFIN
50.736
BJGEYED TUNA 0.000
SKIPJACK
876.359
OlHERS
0.000
0.000
57.332
0.000
870,659
0.000
0.000 0.000 0.000 0.000
80,838 69.660 65.226 51.564
2. 132 1.298 0,652 2.508
961.822 614.908 584.298 381.884
0.000 0.000 0.000 0.000
0.000
33.772
0.548
239.458
0.000
0.000
28.382
0.222
145.120
0.000
0.000
1.568
0.052
11.544
0.000
0. 000 0.000 0.000
5.246 11.630 50.643
0.000 0.000 0.000
37.654 115.418 530.259
0.000 0.000 0,000
0.000
506,597
7,412
5369,383
0.000
Sub Total 927.095 927.991 1044.792 685.866 650.176 435 .956 273.778 173.724 13.164 42.900 127,048 580,902 5883.392
3) IMPORT
ALBACORE
SKJPJACK
YELLOrlFIN
BIG EYE
OTHERS
149.242 0.000
151.128 0.000
106.468 183.380
5.752 0.000
0.000 0.000
0. 000
0.000
0.000
0.000
0. 000
0.000
0.000
0.000
0.000
0.000
24 .828 0.000 0.000 0.000 0.000
0.032 354.396 1040.250 1280.126 344.032
0.000 33,244 47.188 13.066 5·.o78
0.000 0.808 0.082 0.052 0.000
0.000 0.000 0.000 0.000 0.000
8. 196 0.000
805.580 1,552
31.006 347.410
0.000 0,000
0.000 0.000
0.000
0.000
0.000
0.000
0.000
182.266
3977.096
766.840
6.694
0.000
Sub Total 412.590 183.380 0.000 0.000 24.860 388.448 1087.520 1293.244 349. 110 844 .782 348. 962 0.000 4932.896
3) PURSE SEINER
ALBACORE
0.000 0.000 0.000 0.000 0.000 0.000 0.000 0.000 0.000 0.000 0.000 0.000 0.000
SKIPJACK
135.560 0.000 0.000 7.498 0.000 0.000 0.000 0.000 0.000 0.000 0.000 0.000 143.058
YELLC1,/FIN
14.968 0.000 0.000 0.316 0.000 0.000 0.000 0.000 0.000 0.000 0.000 0.000 15.284
BIG EYE
32.518 0.000 0. 000 46.498 0.000 0.000 0.000 0.000 0.000 0.000 0.000 0.000 79.016
OTHERS
0.000 0.000 0.000 0.000 0.000 0.000 0.000 0.000 0.000 0, 000 0.000 0.000 0.000
------------------------------------------------------------------------------------------------------------------------------
Sub Total
183.046 0.000 0.000 54.312 0.000 0.000 0. 000 0.000 0.000 0. 000 0,000 0.000 237.358
GRAND TOTAL 1706.717 1399.127 1627.482 914.706 775.442 944.184 1433.644 1961.832 885.726 1274.470 952.492 656,062 14531.904
JJo

4.2 Page 32

▲back to top
TABLE 3
FOOD FISHES OF FIJI BY FAMILY WITH COMMON FIJIAN NAMES
=F=-ijian-=n-a-m--e=s===
LETHRINIDAE
~wy~~
Ksaaf:b:uattu1a
SS~aa1&uuttiuuidvkauumLduai
SERRANIDAE
~awss,;a1araaewdaamu
~n,l<awak.awa
DKaev~u~bulewa
SCOMBRIDAE
Vsaolfaonlaimol i
Watu
~¥~~~toga
~Meald~.e~ra~1nTuna
CARANGIDAE
~RY;aa~itn:;uol[ooewa Runner
ACANTHURIDAE
~:::.--...-a=:
TBaablaagc1~
Ta
SIGANIDAE
Nuqa
MULLIDAE
MKi ataroko
TRICHIURIOAE
Tovisi
=KLEaIiOkGaNi ATHIDAE
GERREIDAE
Matu
HAEMULIDAE
sevaseva
TERAPONIDAE
Qitawa
Reve
CHANIOAE
Yawa
CHIROCENTRIDAE
VO~=
-CMO-aRh-Yim=PHahA-iE-NI-D=AE
SCATOPHGIOAE
Batekau
S-KY=irPiHsOiSrIiD=wAaEi
=TE=TR-A-D--O-N=TI-D-A=E
Sumusumu
Scientific names
L.
L.
xneabnutnloocshusI la
LLL...vrmearta1jtciesugenlaaatutuss,L,L.s.ermub1rcJ1,onptuesrculatus
GWLL..y.emkm.aonoLs(nsolaOcglrlapalbtntu1e1csruuusssspp.
c1EE;..Pmmimo1eecirnrrpa~aLotunuss spp.
PPE..lrcautnsrccoeopogoLunatuttusastuspsp.
SMSRcceoaarsan~aeeersr0lpo1l11jJsg1a,0Geersurrs,;ss1ppcllopplrl..rlarntoerrscoymnus
gITEC~uvutmshnwyntnnuoonssnauursadsalpabetu~fnc1la1anmcr1Qe1sssLor
ScCEae.arbraal1<nnp;xxtirn.cnsLrpuuUpLmg.aeutnbuorsipshthalmus
AAN..axtsroainout,hsmtoecpgoturensru1ss
SS..cshpriynsuoss,Sp,1yLeorms,Sic.duolaL~1uastus
Upen~us vittatus,U.sulphureus
P". l 11d 1CUS
T. haumeta
L.equutus,L.fasciatus,G.minuta
Gerrus spp.
Plectorhynchus spp.
TM.1ja<rnberui a
Chanos chanos
C.dorab
C.hippurus
s .argus
Kyphosus spp.
Arothron stellatus
Fijian names Scientific names
LUTJANIDAE
L~gairdvamu
Kake
BsUeotow1,,1dtori.
ORUoplusa;,qi._aapm.abl<o~a1.
Regua
!y.~mrpgheonrtu1smnaecmulaatttoupshorus
...oQn.oiu1n:i~an1rqfulaelll.l1llma eatus,L.fulvus
AAg-~Ja1r0r.,enuubss..lrrue~1CfanSs ..
ar.1r.astt,11;amPe0osm1re00n1s~dtseu,ssLa.ksmp.aparl.1abar1. cus
'L. r1vulatus
SCARIDAE
KUalLay1ia
sBcoalbruoms estopppo. n mur.,catus
BELONIDAE
Saku
Tylosuros spp.
HEMIRHAMPHIDAE
Busa
Hemirhamphus spp.
POLYNEMIDAE
UKceulaluka
PL..olalecbteeriu1su,sP.microstomus
ELOPIDAE
Yavuta
M. cyprinoides
MUGILIDAE
~~gxl1!csea
M.ceohalus
VLL...msveeah1lemglo1ep,nVtse.ibsruachanan1.
SPHYRAENIDAE
Oqo
Sphyraena spp.
oC=LaUniPvIDaAE
H,quadrimaculatus
LABREDAE
Varivoce
Cheilinus undulatus
OASYADIDAE
Vaidina
A. kuhli i
CARCHARH IN IDAE
Qio
CICHLIOAE
NCeagrcaphra1rohninus spp,,Triaenodon,
Haleya
T.mossambica
GEHPLIOAE
Ma lake
P. prometh eus
MURAENESOCIDAE
Ikasa
M.cinereus
PLATACIDAE
vunavuna
Platax spp.
OSTRACIDAE
Toa
O.tuberculatus
HOLOCENTRIDAE
Corocoro
Hyripristis spp.
KUHUIDAE
~~~~~~ka
KK..brui ptuensutrliasta
DIODONTIDAE
sokisoki
D.hystrix
~NGRAULIDAE
Vaya
T.balama
Vesa(Smoked fish}

4.3 Page 33

▲back to top
TABLE 3 CONT••.
NON FISH SEAFOOD OF FIJI WITH COMMON FIJIAN NAMES
Fijian names
Scientific names
Fijian names
PRAWN
Hoci
Ura
CRAB
oar\\
Kulcadamu
Ugavule
Kulcaloa
Qarivatu
Lairo
uraudina
Mana
BIVALVES
Kailcoso
Kaidamu
Qaqa
Sigawale
Vasuadina
Katavatu
Cega
Civa
Kuku
KaHF/Wl
TURTLE
=
Taku
vonudina
P. concinnus
P. canaliculatus, P. monodon,
M.equidens, H.rosenbergii, H.lar
sS..
paramamosain
erythrodactyla
Birgus latro
H. messor
T. crenata
c.carnifex
P. versicolor, P. ornatus,
P. penicillatus
T. anomala.
A. cornea
Periglypta puerpera
Gafrarium tumidum
Atactodea striata
T. derasa
T. maxima
T. squamosa
Pinctada magaritifera
Modiolus agripetus
Batissa violacea
Eretmochelys imbricata
Chelonia mydas
GASTRAPODS
Yaga
sici
Tovu
Madral i
Golea
orevula
ECHINODERMS
Daire
Loaloa
vula ·
cawaki
sucuwalu
SEAWEEDS
Nama
Lumiwawa
MISC
Tadruku
Veata
Kui ta
Scientific names
Lambis lambis
Trochus nilot1cus
Trochus pyramis
Nerita polita
Strombus gibberulus
Polinices flemingiana
Hetriatyla scabra
Hicrothele nobillis
Bohadschia marmorata
Tripneustes gratilla
Hicrothele fuscogilva
Caulerpa racemosa, caulerpa sp.
Gracilaria verrucosa
Acanthozostera gemmata
Dolabella auricularia
Octopus sp
·:i..n:n

4.4 Page 34

▲back to top
TABLE 4
MEAN PRICE OF FISH PRODUCTS IN MUNICIPAL MARKETS IN 1969
~pecies
Weighted
Mean prfce
!<----CENTRAL O.IV ---->!<-:-------------:-----------WESTERN
Navua Nausori Korovou S1gatoka Nad1 Namaka Lautoka
DIVBa--------T-a-v-u--a--:R--a-k>1 lr<aNidDRLaTbHas>aI
J/Kg
$2.93 2.71 3.10 2.49 3.23 2.96 3.10 3.14 2.96 2.77 2.80 2.08
Kawago
Kac11<.a
Sabutu
Kabat1a
Mama
DBougon.ivud'1
Sa utudamu
Sa utukula
Kawa .. awa
Kavu
Kas~La
Sen, l<awa kawa
oonu
OSaetaablaulewa
mtoo\\ WWSaaanl"uaoolanhtoga
veli~fln
Mackera Tuna
~~~~Loa
Yatvle .
Vot,n1mol 1
Rarnoow Runner
Kl
Ose
MLaa1tdaarmouko
Dam1,1
Batl
Ka .. e
Regua
B~ovto.
sew1dr1
§UgL:u~q~ap.ba~i
.
1
Bedford
Ta~ace
~a ag1
KuafLavHil
Ker~l<erecula
Uculuka
Kela
Koto
Kava
Kanace
t:,ol 1sa
o,tawa
~~nhna
Shark
~~~~
Sal<u
Yawa
VOCi5lo1vo1.
TOV]Sl •
KMaa1t.11kimllah1
GMBuaartite,u11<a. u . .
s, r1s1 r1wa1
SCuemv1,a1 seva
var1voce
Mii ake
Ikasa
¥gQT~gQa f i s h )
Corocoro
~~M~gka
!I~! Ie~
!~-ii
$2: §a.
2.9t~s-
2.89
2.57
3.03
31
·0
!:~~ 38 4.22 4.19 z:
4.16
i:gs ~:~B
tH
~:~8
ti
1 98
~21.;:7Q~~l
~:~
2 65
3'.80
3.03
!il
2.17
~-:J~
2 j~
;;;g
2.00
2.12
3. 24-
2.47
,.96
2._08
;.~8
;;;;
1.80
3.00
::::
1.83
2.83
2.00
2.14
,.60
1:il
1:~a
¥~~~sumu
$2.84
3.40 2.00
Nathaly
$T.85
1.85
is:~& ¥~f~ed-;~sh
3.01 4.50 . 4.02 4.47 5.56
5.00 5.00
!:Il

4.5 Page 35

▲back to top
TABLE 5
MEAN PRICE OF NONFISH PRODUCTS IN MUNICIPAL MARKETS IN 1989
($/Kg) Weighted !<---------CENTRAL DIV.---------->l<-----------------WESTERN DIV.--------------->i<NORTH)J
Species Mean price Navua Suva Nausori Korovou Sigatoka Nadi Lautoka Ba Tawa Rtiki raki Labasa
PRAWNS
Moci
$6.18
Ura
$9.09 7.00
LOBSTERS
Uraudina $1 t. 05
Uraukula
Urautamata
Mana
$2.34
CRABS
earl
$8.60 5.52
0arivatu $3.63
Kukaloa $2.41
Kukadamu $2.39
Lairo
$2.95
BIVALVES
Kai
$0.41 0.32
Kaikoso $0.49 0,20
Kaidawa $0.78 0.50
aaqa
$0.41
Kaivadra
Sigawale $0,46
Vasuadina $1.26
Katavatu $2.59
aeqe
$0.60
Clva
$0,35
Kul:.u
$0.53
Civaciva $1.46
Kalokalo
Bu
$1.00
GASTROPODS
Yaga
$0.88
Tivikea $0.37
Golea
S1c1
$0.58 0.90
$2.03
Tovu
$0.80
Madral i $0.47 0.77
ECHINODERMS
Oalro
Vula
$0.61 1.53
Loaloa
$1.20 1. 20
Sucuwalu
Ori
$1.02
cawaki
$1.19 1. 00
TURTLES
Vonudina $3.21 3.00
Taku
SEA \\./EEO
Lumiwawa $1.52 1.37
Sagati
$1.51
Naina
MISC.
Tadruku $1.66
Veata
$1.96
Kuita
$2,69
7.35 7.16
8.83 9.06
12.00 9.89
5.40 4.50 3.79 3.60 3.81
12.49 12.63 6.20 9.66 9.61 6,29
11.78
12.00
5.18
2.24 2.59
8.53 9.72
7.71 10.82 10. 15 5.62 9.28 9,47 5.08
3.63
2.54
2.17 2.69
2.60 2.50 2.60 2.34 2.50 2.30
2.55 2.58 2.34 2.27 2.25 2.30
2.86 2.66 3.00
3.21 2.75 3.22 3.02 2.56 2,75
0.31 Q.32 0.39 0,40 0.53 0,48 0.51 0,54 0.52 0.28
0,46 0,36
0.64 0.59 0.59 0.61 0.62 0.29
1.61 0.68
0.66 0.58 0.58 0.60 0.61 0.32
0.25 0.24
0.58 0.40
0.28
0.44 0.37
0.46 0.55 0.40
1.12 2.52
3.00
0.60
2.80 2.53 2.74 2.55
2,63
0.60
1.00 0.32
0.35
0.67 0.35
1.46
0.35 0,34 0.48 0,36
0.34
0.18
1.00
0,62
1.41 0.91
0.32 0;25
0.72 0.36
2.21 1.86
a1..s0o0
0.60
0.24
0.63 0,63 0.69 0.60 0.67 2.83
0.60 2.19
0.47 0.48 0.48 0.49 0.40 0.96
1.59 2.47
0.50
0.60
0."45
0.40 0.42
0.43
0.95 0.69
0.53 0.62 0.59 0.51 0.52 2.43
1.02
1.41 0.65
3.50
1.00 0.90
1.01 1.03
1.65 2.17
1.97 2.00
2.65 2.53
2.50
3.00 3.00
3.00
2.95
3.00
2.00 2.00 1.74 2.00 2,00 2.60
2.36
2.00 2.00 1.69 2.00 7..00 2.51
1.26 2.00
0.80 0.50 2.50
2.00 2.00 1.74 2,00 2.00 2.60
3.00 2.96 3.00 2.92
3.50

4.6 Page 36

▲back to top
TABLE 6
VOLUME OF FlSH SALES THROUGH MUNICIPAL MARKETS IN 1989
Species
TGORATANOL !<N--a-v-u--a---CNEaNusToRriAKLorDoIvVciu---T--o-t-a-l>1S<i-g-a-t-o-k--a---N--a-d-i-----N-a~mEakSaTELRauNtoliOa JVIBSaION--T--a-v-u-a----R--a-k--ir-a--k-i---T>]o<taNlORLTabHas>aI
GRAND TOTAL(Mt) 643.77 19.51 33.50 1.51 54.52 4.27 96.73 11.85 '180.40 107.19 49.89 35.85 486.18 103.07
Fresh fish {Mtl 618.40 19.35 31.89 1.41 52.65
Vesaisalted(Mt)--25 37___ 0-16----1-61 ____0_10 ---1-87-
~!~,igamaa!Va
3,
11 '.l
11
·.,,
l
ffi~iK~awiaviau~w~ad~i
~aavsauka
awakawa
1
~
I
2:
.
taaraiewa
81.
'I.
~au
'matono~ttoga
! ::,
Mac~lt~er7alnTuna
.
4
V~~Yaf;io:n1l,1to1ea~Rl'1unner
: ti
'.
,
Ose
bM~aat~mrouko
KBaakt1e
i
11:':.
~ua
1:
Mto1,1do.
I: I
ii~f'd~a:l .
osr1m1
aa aagga1e~
I
uffvi
1 :.,i
~ry~~recula
~au a
:,
Itvoa
I
fMOra1csea
tawa
3,:
~l~kna
:I
Li0 •
.
5
TO1V\\1)S01] ,
:1 ~'
ial;lkmah1
M:!aetu~~u
1
~rvva1ss1e.vr1a.wa.1
:1
1,1
var1race
~Mae
ffff6 TVeoouarno?~onXroa f 'lS h)
YDaavwna1ltSpvrpoOaa1av~a1a.1
:
•'
~Va~a~~WU
1
.
..,,,,
:i
I1
::
)
:1
:
:
~
)
~
l
3.63 96.04 11.85 179.77 106.85 49. 46 35.82 483.42 82.33
0 6L----0-69____0 00----0-63___ 0-34____0_43___ 0 03___ 2.76
, .'7
2
I•~
1 •'
'
3' •
·'
1:• •I,
!:
:•
.
20.74
>
1
.
:, ~
:,
~ 1 :, ,
:i ;, ~
1
1
2
1
.
::
:1
··1,
1 :i
.
:1
1.
1
6
:.I!
...
1 ...
3 . 1 ..
.
1: !
,(
:,
'
•I
.
11'.
)
..
~:
. t..
..:
..
•I
,,
I:,
.
:j
.
.
• 11
:• I,
:~
':
:,
.:i'
:'
'
2
:1
: .. .'
..,
.
.
.
....
.
.
.. 1
.
.
I
..
. ..
1
1
! 1.
' ..
....
.
..
..
•I
j•
I•
.. 2 ··'' ..
.:~;
~
...
.
...
:
4
.
I ...
....
.. 0 ...
.. .
' 11
1,
.
:1
.......
.
..
....
.
1

4.7 Page 37

▲back to top
TABLE 7
VOLUME oi:-NoN- Ft_SH SALES THROUGH MUNICIPAL MAru::ETS IN 1989
GRAND l<-----------CENTRAL DIV.------------>l<------------------~ESTERN DIV.---------------------->l<NORTK>I
Species TOTAL Suva Navua Nausori Korovou Total Sigatoka Nadi Lautoka Ba T.ivua Rakiraki Total L11basa
\\.lt(Mt) 1049.65 297.63 27.88 168.72 8.09 502.32 20.98 80.22 190.91 123.92 69.27 29,85 515. 15 32.18
PRAWNS
Moci
3.37 1.41 0.00 0.57 0.00 1.98 0.00 0.41 0,69 0.20 0.06 0.03 1,39 0.00
Ura
7.64 2.97 0.04 0.77 0.00 3.78 0.00 0.61 0.61 1.22 0.13 0.23 2.80 1.06
LOBSTERS
Uraudina 0.70 0.04
Uraukula 0.00- 0.00
0.00
0.00
0.15
0.00
0.00
0.00
0.19
0.00
0.00
0. 00
0o..o0o0
0.-16
0.00
0.00
0.00
0.02
0.00
0.00
0.00
o. i8
0.00
0.33
0.00
Urautama 0.00
Mana
5.41
0.00
3.62
0.00
0.00
0.00
1.59
0. 00
0.00
0.00
5.41
0.00
0.00
0.00
0.00
0.00
0,00
0o..o0o0
0.00
0.00
0.00
0.00
0.00
0.00
0.00
0.00
CRABS
0ari
_28,46
Qarlvatu 0.52
5,84
o.oo
0,50
0.00
6.32
0.00
0.00 12.66
0.00 0.00
0.67
0.00
0.99
0.15
2.17
0.00
3.56
0.00
0.31
0.00
0.38
0.00
8.08
0.15
7.72
0.37
Kukaloa 11.98 5.67 0.00 3.92 0.00 9.59 0.00 1.15 0.20 0.32 0.47 0.06 2.20 0.19
Kukadamu 1.99
Lairo
6.44
0.00
0.85
o0..o0o0
0.00
1 .00
0.00
0.07
0.00
1.92
0,00
o.oo
0.27
2.32
0.36
0,75
0.37
0.87
0.63
0.97
0.08
0,97
1.71.
S.88
0.28
0.64
BIVALVES
Kai
816.02 219.93 26.81 134.00 8.02 388.76 20.31 57.32 162.07 104.56 52.01 21.44 417.71 9.55
Kaikoso 63.89 29.40 0.09 9.97 0.00 39.46 0.00 4.45 4.26 2.84 4.42 1.88 17.85 6.58
Kaidawa 11.55 l.84 0.02 1.49 0.00 3.35 0.00 1.76 2.20 1.40 1.67 0.84 7.87 0.33
aaqa
0.90
Kaivadra 0.03
Sigawale 2.35
0.40
0.00
0.47
o0..o0o0
0.00
0.01
0.00
0.28
0.00
oo..oooo
0.41
0,00
0,75
0,00
0.00
0.00
0.40
0.00
0.98
0.09
0.00
0.42
0.00
0,00
0.20
0.00
0.00
0.00
0.00
0.00
0.00
0.49
0.00
1.60
0.00
0.03
0.00
Vasuadin 3.93 '3.43 0.00 0.36 0.00 3.79 0.00 0.00 0.00 0.00 0.00 0.00 0.00 0.14
Katavatu 9.61
Qeqe
0.25
0.04
0.08
0.00
0.00
0.00
0.00
0.00
0.00
0.04
0.08
o0..o0o0
1.90
0.00
5.99
0.00
0.59
0.00
0.75
0.00
0o..o0o0
9.23
0.00
0,34
0.17
Civa
1.08
Kuku
3.40
Civaciva 0.64
0,05
1 .49
0.64
o0..o0o0
0.00
o1..0132
0.00
0.00
0.00
0.00
1.08
1.61
0.64
0.00
0.00
0.00
0.00
0.16
0.00
0.00
0.36
0.00
0.00
0.52
0,00
0.00
0o..o3o8
0.00
0.00
0,00
0.00
1.42
0,00
0.00
0.37
0.00
Kalokalo 0.06 0,00 0.00 0.00 0.00 0.00 0.00 0.00 0.00 0.00 0.00 0.00 0.00 0.06
Bu
0.23 0.00 0.00 0.00 0.00 0.00 0.00 0,00 0.06 0.00 0.00 0.00 0.06 0.17
GASTROPODS
Yaga
Tivikea
Golea
7.83
0;30
5.05
2.10
0,15
2.06
0.00
0.00
0.07
0.67
0.02
0.21
o0..o0o0
0.00
2.77
0.17
2.34
0.00
0.00
0.00
o1..o1o1
0.88
0.99
0.00
0.58
1.21
0.00
0,38
1.09
o0..0sa0
0.20
0.04
0.12
4.60
0.04
2.54
0.46
0.09
0.17
Sici
2.72 1.14 0.00 0.34 0.00 1.48 0.00 D,00 0.00 0.00 0.00 0.34 0.34 0.90
Tovu
0.39 0.19 0.00 0.12 0.00 0.31 0.00 0.00 0.04 0.00 0.02 0.00 0,06 0.02
Madral i 0.37 0,05 0,05 0,02 0.00 0.12 0.00 0.10 0.12 0.00 0.00 0.00 0.22 0.03
ECHINODERMS
Daire 27.75
4.26
0.21
1.47
o.oo
5.94
0.00
3.91
6.44
4.30
4.63
2.49 21.77
0.04
Vula
0.00 0.00 0.00 0.00 0.00 0.00 0,00 0.00 0.00 0.00 0.00 0.00 ' 0.00 0.00
Loaloa 0.01
sucwalu 0.00
Ori
0.42
0,00
0,00
0.42
0o..0e1o
0.00
0.00
0.00
0.00
0. 00
0.00
0.00
0.01
0.00
0.42
0.00
0.00
0,00
0.00
0.00
0.00
0.00
0.00
0.00
0.00
0.00
0.00
0.00
0.00
0.00
0.00
0o..o0o0
0,00
0,00
0.00
0.00
0.00
0,00
Cawaki 2.47 1.74 0.01 0.69 0.00 - 2.44 0.00 0.00 0.00 -0.00 0.00 0.00 0.00 0.03
TURTLES
Vonudina 1.66
Taku
0.05
0.00
0.00
0.04
0.00
0.24
0.00
0.00
0.00
0.28
0.00
0.00
0,00
0.06
0.00
0.08
0.00
0.00
0.00
0o..o1o5
0o..o0o0
0.29
0.00
1.09
0.05
SEAWEED
Lumiwawa 3.79
Sagatl 0.05
Nama
4.88
1.14
0.00
1.19
0.03
0.00
0.00
0.46
0.00
0.82
0.00
0.00
0.00
1.63
0.00
2.01
0.00
0.00
0.00
0,39
a0..s0o0
0o..o6o9
0.63
0.46
0.00
0.55
0.32
0.00
0.45
0.21
0.00
0.26
2.07
0.00
2.39
0.09
0.05
0.48
MISC .
Tadruk.u
Veata
Kuita
3.59
2.41
3.46
3.04
0.70
1.08
o0..o0o0
o.oo
0.32
0.52
1.24
0.00
0.00
0.00
3.36
1.22
2.32
0.00
0.00
0.00
0.08
0.18
0, 14
0.02
0.34
0.59
0.00
0.27
0.10
0.01
0.09
0.11
0.09
0.19
0.00
0,20
1.07
0.94
0.03
0.12
0.20

4.8 Page 38

▲back to top
TABLE 8
VOLUME OF FISH SALES AND VALUE..• PER DIVISION BY MAJOR FAHILIES
I<---- CENTRAL DIVISION --->I<------- ESTERN DIVISION ------>I<------- NORTHERN DIVISION ------->f
Fami Ly name Markets outlets Total
Markets Outlets Total
Markets outlets Total
Wt (Ht)
54.52 2539.88 2594.40
486.18 790.94 1277.12
103.07 793.28 896.35
Lethrinidae
Serranidae
scombridae
Carangidae
Mu l lidae
L_utj anidae
Acanthuridae
Scaridae
Belonidae
Polynem1dae
Elopidae
Hugi l idae
Siganidae
Sphyraenidae
Trichuridae
Leiognathidae
Gerridae
Haemul idae
Theraponidae
Smoked Fish
Salted Fi sh
Misc.
6.48
2.98
1.24
2.55
3.38
4.62
1.20
1.45
0.36
t.85
0.27
11.32
1.45
1.02
1..16
4.66
0.90
0.24
1. t3
1.87
o.oo
4,39
412.01
418.23
401.55
158, 28
45.58
214.76
61 .52
175.97
8.00
13.23
2.17
252. 16
25,80
36.17
16.38
43.08
8,92
14.87
17.57
0.09
o.oo
213.54
418.49
421. 21
402. 79
160.83
48.96
219.38
62.72
177.42
8.36
15.08
2.44
263.48
27. 25-
37.19
17.54
47.74
9.82
15. 11
18.70
o1..o9o6
217.93
94.45
46.90
79.03
43.06
5.26
51.57
5.47
7.05
0.86
4.41
0.58
30.02
5.57
49.90
9.66
6.54
1 .62
4,68
3.01
o2..o76o
33.78
127.80
76.55
253.86
74.76
1. 92
90.79
T.95
29.39
0.13
0.80
0.17
17.56
4.38
59.43
1.87
1.83
0.18
9.75
1.40
0.00
0.00
36.42
222.25
123.45
332.89
117 .82
7.18
142.36
7.42
36.44
0.99
5.21
0.75
47.58
9.95
109.33
11.53
8.37
1.80
14.43
4.41
2.76
0.00
70.20
7.18
2.48
14.f2
11.32
2.07
8.51
3.46
2.35
0.76
2.42
0.62
6.68
0.26
7.45
0.14
2.05
0.48
1.85
0.26
14.60
6.14
7.87
90.94
54.30
170.93
89.78
11.63
56.09
16.16
92.46
2.82
14.10
2.54
51,34
6.18
67.30
0.13
7.60
3.32
22,21
0.79
0.00
0.00
32.66
98.12
56.78
185.05
101. 10
13.70
64.60
19.62
94.81
3.58
16.52
3.16
58.02
6.44
74.75
0.27
9.65
3.80
24.06
1.05
14.60
6.14
40.53
Fami Ly name
Grand Total
WT(Mt) $ (000)
4767.87 14716.01
Markets Markets Outlets
WT(Mt) $(000) WT(Ht)
643.77 1891. 73 4124.10
Outlets
$(000)
12824.28
Lethrinidae
Serranidae
Scombridae
Carangidae
Hullidae
Lutjanidae
Acanthuridae
Scaridae
Belonidae
Polynemidae
Elopidae
Mugi l idae
Siganidae
Sphyraenidae
Trichuridae
leiognath1dae
Gerridae
Haernulidae
Theraponidae
Smoked Fish
Salted Flsh
Misc,
738.86
601.44
920.73
379.75
69,84
426.34
89.76
308.67
12. 93
36.81
6.35
369.08
43.64
221. 27
29.34
65.76
15.42
53.60
24.16
19.32
6, 14
328.66
2547.36
2103.88
2814.83
1138.42
206.69
1296.57
264.92
906.13
31.85
98.29
13.19
1144. 36
160. 17
553.72
54.32
2.15.32
41.97
152.10
71.85
62.43
50,74
786.90
108. 11
52.36
94.39
56.93
10.71
64.70
10.13
10.85
1.98
8.68
1.47
48.02
7.28
58.37
10.96
13. 25
3.00
6.77
4.40
19.23
6.14
46.04
392.81
195.54
240.22
159.64
26.74
197,69
23.90
25.63
4.30
22.48
2.68
127.73
26.48
158.55
17.28
-33. 34
6.90
20.54
10.87
62.08
50;74
85.59
630.75
549.08
826.34
322.82
59. 13
361.64
79.63
297.82
10.95
28.13
4.88
321.06
36.36
162.90
18.38
52.51
12.42
46.83
19.76
0.09
a.co
282.62
2154.55
1908.34
2574.61
978.78
179.95
1098.88
241.02
880.50
27.55
75.81
10.51
1016.63
133.69
395.17
37.04
181. 98
35.07
131. 56
60.98
0o..o3o5
701.31
TABLE 9
VOLUME OF NON FISH SALE & VALUE.•• PER DIVISION BY MAJOR GROUPS
[<---- CENTRAL DIVISION--->[<------- ESTERN DIVISION------>!<------- NORTHERN DIVISION------->!
Family name Markets Outlets Total
Markets Outlets Total
Market Outlets Total
Wt(Mt)
502,32 323.84 826.16
515.15 118, 10 633.25
32.18 117.39 149.57
Crustaceans
Bivalves
Gastropods
Echinodenns
Sea weed
Turtles
Misc.
35.52
439.95
7.19
8.80
3.64
0,28
6.94
50.55
257.46
1.81
5.19
2.36
3.01
3.46
86.07
697.41
9.00
13.99
6.00
3.29
10.40
22.39
456.23
7.79
21.77
4.47
0.29
2.21
91.78
23.42
o.oo
0.00
0.00
0,40
2.?0
114.17
479.65
7.79
21.77
o4,.4,s7i
4.71
10.59
17.74
1.67
0.07
0,62
1. 14
0,35
38.05
0.20
0.00
33.97
0.00
0.34
44.83
48.64
17. 94
1.67
34.04
0.62
1.48
45.18
Fami Ly name
Grand Total
Wt (Ht) $COOOl
1608. 98 2773.56
Markets Mark.$ts 0-Jtlets
.Wt (Mt) $(000) Wt(Ht)
1049.65 868.93 559.33
outiets
$(000)
1904.63
1rus taceans
',Ii valves
)astropods
khinodenns
iea weed
lurtles
lisc.
"'====
248,88
1195.00
18.46
69.80
11-09
5.46
60.29
1837.07
484.37
21. 76
75.86
16. 16
17.68
320.66
68.50
913.92
16.65
30.64
8.73
1. 71
9.50
383.17
408.55
17.45
20.49
13.85
5,19
20.23
180.38
281.08
1.81
39.16
2.36
3.75
50.79
1453. 90
75.82
4.31
55.37
2.31
12.49
300.43

4.9 Page 39

▲back to top
TABLE 10
VOL~~E OF. FISH SALES THROUGH NON MUNICIPAL MARKETS IN 198~
Spec.ies
GTROATNAOL [H<-/-c-r-k---L-a-q--e-re--HR--eoCst&eElCsNafTBfR/tAJDtLclehDresIrSVu~p-hm-o-pK-s-ts---sR-i,-do-.ei-ds----U-A-un>xi1t <R'-H-e-os-&t-e-cl-asWfFB/t~DJtTeEersRrSNuSphmooprJvstt.s---sR-i-,oo-ae>dsl<S--Su-hp-om-NpKsOtsRRHTeosH&teEclsaRfBFN/LDJOtclenlVresr.--UA-n-1-~>t I
GRAND TOTAL(Ht)4124.10 236.01 128.79 88.85 738.04 501.14 765.48 81.57 357.61 ~2.50 114.27 256.55 104.02 14.80 572.60 101.87
Fresh fish (Ht)4124.01235.92128.79 88.85 738.04 501.14 765.48 81.57 357.61 62.50 114.27 256.55 104.02 14.80 572.60 101.87
vesa/salted(Htl o 09
I~f'~~io
Sa~Utl,l
maa t i a
SS~aaaawv~uuuao~tnuuai~wvauuaTduaj
Kas;,la
in1kawakawa
WaI~au~ualewa
\\.lam -
l!lr
ti17:
211,;l
~~ i
•'
0-09
J
1 '"
I:
1
.
o. oo
1:
I:
1•
..
o oo o oo o oo - o oo-- o-oo___o_oo___o_oo___o_oo___o_oo___o_oo-- ·o oo o oo -0-00-
. I 2°'.J '-1
>: {,, : :J
:!
)
7 1'·1
1
1 .I
2 : ll
I:,
3. 1
6
.:1 11.:1
2
I:
1 :,
I. 20
2 :1
1g ~ ., 1
.. ~
I '.'ii
16
I .. ·•I,I
I
1 ·•
• I:
. I.
J :i t ·' "
:1 '
:i .
I
, :,
:1 )
i(
:1
!:,
I
I
I
) 21:
7 :!
.~
.:!, .
rn'J~~toga
H~aec,kf.e~rarinTuna
❖gt~li SSaa~aa oa
~f, Runner
1
28
I•
f:,,, "..' ~
1i:
i:
::,,
I :,
5
.,
Ose
baaam1t1~,1raomkuo
~:~~
ffoegua
~H~~tO~l,aJd. ~i .
iaoa saargc~11e~~m1
Tf .
U fYl
l.
f
I:
l::1,"!
;•JI
r: 21:1:
l
I•
:,
1
:,
'~
~~rTf~recula
" I:
t~Oavataou a
0!'.1laot~a~111csaea
Se~av, ar~na
~uqa
sY~aw~~a
01yoj
f1! ..·,,, 2l:
1,. !
5
.,
i:
1i:
~
1!:
1
7
TM~aiJ~iSi:f\\•i
Is1eaau1,1mvttrre1u1av,1~ssae1uvraiwai
amgce
~ ~asa
!ag~f~Qafish)
rogoro
5H::,i
1,
~
4 .~
l
:I
I:,
.~
'
I .,
·1
:)
:i
I :I
1
, :,
4
:,
I: 1:
,;· 1
i.
l I:
:1
1
I :1
:1
,,•I
10: :' I;
·, ~ : II
.. .. I•
1
:
2
I :, 3 :.
•:
:,
I :,
4
1
1
51
1
:,
:'.1,
1
•.
•! ;i:
: .g 1: J
::,,?,
l
i l
<3
1
I,
)
:1 1 ::
'
'
·,
l
l
li!
)!
.,
·:,,
. • II
.,
:~
.i
I ,I
1
.:,,
:1
:,
:1
:I '·, l
I :'.1I
.,
i
•I
;
6 :.i, 1 :1
1 :1
3 :,
. ,,•l
2
!'I
::
l
,.
j
~
1
1
1
;
.
'
> ,.
:1
4 :,
.,
.,
I ·:
:i
1' .:,i
:'.1,
:1
:1 J
.,
M
tsI0~1pa1r$pgQ1~aa,1
ya1Vwl pav1
2g~~~fy
•I
I•
2, :·
:,
:1
~~r~~u
1
2
:, ....
J i . -- ga~r J1r.is~
Castroflsh
1,: ) . .
V-e-sa----------------0-.0-9-----0-.0-9-----0-.0-0---
0-,00---0--.0-0--
0- .00
b: )
0.00 0.00
0.00
0.00
0.00
0.00
0.00
0.00
0.00
o.oo
ARNFue//0xscfkeuCrnasfit==== ARNFiueassxb,.~1u, alk~uearlaaarynuletcur&rsne.ieCtkafe

4.10 Page 40

▲back to top
TABLE 11
VOLUME OF NON FISH SALES· AT NON MUNICIPAL MARKETS IN 1989
Species
!<--------------CENTRAL orv.---------------->l<------WESTERN orv.----->l<----NORTHERN orv.----->l
GRANO
Htls ButcheShops Road Aux Htls Butcheshops Road Htls Butcher Shops Au_x
TOTAL N/Crk LagereRes&CafF/dlrsSupmkt sides Unit Res&CafF/dlrsSupmkt sides Res&ca F/dlrs Supmk.ts lkll t
Wt(Mt)
559.33 40.51 4.97 10.11 0.57 9. 94 254. 20 3.54 71.34 0.06 1.56 45.14 1.10 97.87 10.85 7.57
PRAWNS
Moci
2.01 0.44 0.65
Ura
63.41 1.28 1. 19
LOBSTERS
Uraudina
52.29 2.08 0.04
Mana
0.92 0.00 0.03
st ipper
2.74 1. 97 0.00
CRABS
aari
aarivatu
51..D2O8
1. 96 1. 95
0.0D 0.00
Kukaloa
4.73 2. 75 0.70
Kukadamu
0.57 0.08 0.00
Lairo
2.10 0.54 0.17
·3' spotted
0.33 0.00 0.00
BIVALVES
Kai
275.28 11.90 0.00
Kaikoso
2.77 0.80 0.00
Kaidawa
Qaqa
0,01 0.01 0.00
0.00 Q;OO 0.00
Kaivadrll
0.31 0.31 0.00
Sigawale
1.48 1.48 0.00
Vasuadina
0.33 0.00 0.00
Katavatu
0.14 0.05 0.00
Qeqe
0.62 0.62 0.00
Civa
0.15 0. 15 0.00
Kuku
Civaciva
0o..o0o0
0o..o0o0
0.00
0.00
Ka Lokalo
0.00 0.00 0.00
Bu
0.00 0. 00 0.00
GASTROPODS
Yaga
0.02 0.02 0.00
Tivikea
0.66 0.66 0.00
Gol'ea
0.55 0.55 0.00
Sici
0.60 0.60 0.00
Tovu
Madral i
0.00 0.00 0.00
0.00 0.00 0.00
ECHINODERMS
Daire
sucuwalu
0, 16 0.02 0.00
0.73 0,07 0.00
Greenfi sh (BOH)
8.49 0.06 0.00
Drilol i (BDM)
10.32 O.D6 0.00
Tarasea
8.03 4.97 0,00
Tuvula !Lal
6.25 0.00 0.00
Leal.ca
0.25 0.00 0.00
Sucudrpu
Taraqa
0.20 0.00 0.00
0.00 0.00. 0.00
Vula
1.10 0.00 0.00
uiulevu(Curryfishl 0.36 0,00 0.00
DrivattJ
0.01 0.00 0.00
Ori
3.25 0.00 0.00
TURTLES
Vonudiria
3.51 , • 34 0.00
Taku
0.24 0.00 0.24
SEAWEED
Lomiwawa
1.09 1.09 0.00
Sagoti
0.00 0, 00 0.00
Nama
1.27 1.27 0.00
MISC.
Tadruku
1.20 1. 20 0.00
:,.'eata
1.21 1.21 0.00
Kuita
3.94 0. 97 0.00
Trochus shells
35.99 0. 00 0.00
Turtle shells
0.02 0.00 0.00
MOP shells
8.41 0. 00 0.00
0.00
5.34
o0..0103
o.oo
8.26
0.92 0.00 0.00 0.00 0.00
2.55 3.11 22.34 0.00 1.54
0.00 0.00
5.35 0.46
0.00
6.56
0.00 0..00
4.93 0.37
2.27
0o..o0o0
0.20
0.00
0.00
o0..o3o0
0.00
0.55
0.89
0.00
0.00
3o5..o5o0
0.06
0.00
0.02
0.00
0.00 0.00 0.00 0.00 0.00
0.00 0.30
0.00 0.00
0.00 0.00
9.13
0.00
0.77
o1..o6o1 0o..o2o3
0.00 o.oo
2.50
0.00
0.00
0o..o0o0
o.oo
0.20
0.00
0.00
0.00
0.00
0.00
o1..o3o6
oo..oooo
0.00
o.oo
4.32 0.00 10.00 0.00 0.00 15.76 0.34
0.00 0.00 0.00 0.00 0.00 0,00 0.00
1. 28 0.00 0.00 0.00 0.00 0.00 0.00
0.00 0.00
0.54 0.00
0.00
0.00
0o..o0.0o
0.00
0.00
0.49 0.00
0.72 0.00
0,00 0.00 0.00 0.00 0.00 0.00 0.00
7.50
0.00
0.00
0.00
0.13
0,33
4,31 1.08
0.00 0.00
0.00 o.oo
0.00 0.00
0.00 0,00
0.00 0.00
o.oo
0.00
0o..0o0o
0.00 240.16 ·0.00
o.oo 1. 97 0.00
0.00 0.00 0.00 0,00 0. 00
0.40 0.00 0.00 22.82 0.00
0.00 0.00 0.00 0.00 0.00
0,00 0.00 0,00 · 0.00 0.00
0.00
o0.,o0o0
·0o..0oo0
0.00
0,00
0.00 0,00
0.00
0o..o0o0
0.00
0.00
0.00
o0..o0o0
0.00
0.00 0. 00
0.00 0.00
0.(Y.) 0.00
0.00 0.00 0.00
0.00 0.00 0.00
0.00 0.00 0.00
0.00 0.00
0.00 0.00
0.00 0.00
0.00
0.00
0.00
0.00 0.00
0.00 0.00
0.00 0.00
0.00
o0..o0o0
0.00
0.00
0.00
0o..o0o2
0.00
0.00 0.00
0.00 0.00
0.00 0.00
0.20 0.00 0.00
0.00 0.00 0.00
0.00 0.00 0.00
0.00 0.00
0.00 0.00
0.00 0.00
0.11
0.09
0.00
0.00
o.oo
0.00
0.00
0.00 0.00
0.00 0. 00 0.00
0o..o0o0
0o..0o0o
0.00
0.00
0.00
0.00
oo0o....ooo0ooo0
0. 00 0.00
0oo.:.oo0oo0·
0. 00
0.00
0. 00
0.00 0.00
0.00 0.00 0.00
0.00
0.00
0.00
0.00
o0..0o0o
0.00 0.00 0.00
0.00 0.00 0.00
0.00 0.00
0.00 0.00
0.00 0.00
0.00 0.00
0.00 0.00
o0..o0o0
0.00
0.00
0.00
0.00
0.00
o0..o0o0
0.00 .0.00
0.00 0.00
0.00 0.00
0.00 0.00 0.00 0.00 0.00 0.00 0.00 0.00 0.00 0.00 0.00 0.00 0.00
0.00 0.00 0.00 0.00 0. 00 0.00 0.00 0.00 0. 00 0.00 0.00 0.00 0.00
0o..o0o0
0o..o0o0'
0.00
0.00
0.00
0.00
0.00
0o..0oo0
0.00
0.00 0.00
0.00 0.00
aa..ccoo
0.00
0.00
0.00 0.00 0.00
0.00 0.00 0.00
0.00 0.00 0.00
0.00 0.00 0.00
0.00 0.00
0.00 0.00
0.00 0.00
0.00 0.00
0.00
0.00
0.00
0.00
0.00 0.00
0.00 0.00
0.00 · 0.00
0.00 0.00
0.00
O.DD
0.00
0,00
o0..o0o0
0.00 0.00 0.00
o0..o0o0
0.00
0.00
0.00
0.00
0.00
o0..o0o0
0.00
Q.00
o0..o0o0
0o..o0o0
0.00
0.00
0. 00
0.00
oQ..o0o0
0.00 0. 00 0.00
0.00
0.00
0.00
0.00
o0..o0o0
0.00 0.00
0.00 0. 00
0.00 0.00
0.00 0.00
0.00 0.00
0.00 0.00
0.00 0.00
0.00 0.00
0.00 0.00
0.00 0.00
0.00 0.00
0.00 0.00
0.00 0.00
0.00 o.oo o.oo
0.00 0.00 0.00
0.00 0.00 0.00
0.00 0.00 0.00
0.00 0.00 0.00
0.00 0.00 0. 00
a0..c0o0
o0..o0o0
0. 00
0.00
0.00 0.00. 0.00
0.00 0.00 0.00
0.00 0.00 0.00
0.00 0.00 0.00
0.00 0.00 0.00
0.00 0.00 0.00
0,00 0.00 0.47
0.00 0.00 8.43
0.00 0.00 10.21
0.00 0.00 3.02
0.00 0.00 6.25
0.00 0.00 0.05
0,00 0.00 0.12
0.00 0.00 0.00
0.00 0.00 0.03
0.00 0.00 0.00
0.00 0.00 0.-00
0.00 0.00 0.00
0.00
o.oo
0.14
0.19
0,00 0.00
0.00 0.05
0.00 0,04
0,00 0.00
0.00 0.20
0.00
0.00
o0..o0o8
0.00 1.07
0.00 0.36
0.00 0.01
0.00 3.25
0.00
0.00
0.00
0.00
o0..o0o0
1.00 0. 43
0.00 0.00
0.40 0.00 0.00
0.00 0.00 0.00
0.00 0.00
0.00 0.00
0.00
0.00
0,00 0.34
0.00 o.oo
0.00 0. 00 o.oo
0.00 0.00 o.oo
0.00 0.00
0.00 0.00
0.00 0.00 0. 00
0,00 0.00 o.oo
0.00 0.00
0.00 0.00
0.00
0.00
0.00
0.00
o0.,o0o0
0.00 0.00 0.00 0.00 0.00 0.00 0.00 0.00 0.00 0.00 0.00 0.00 0.00
a.DO
0.00
0.00
0.00
0o..0oo0
0.00 0.04 0.00
0.00
0o..o0o0
0.00
0.00
0.00
0o..o0o0
Q.00
0.00 0.00
0.00 0.00
0.02 0.00
0.00 0. 00
0,00 0.00
0.00 0. 00
0.00 0.00 0.00
0.00 0.00 0. 00
2.50 0.00 0. 00
0,00 0,00 0.00
0.00 0.00 0.00
0.00 0.00 0.00
0.00 0.00 0.00
0.00 0.00 0.00
0.00 0.00 0.41
o.oo o.oo 35,BS
0.00 0.00 0,02
0.00 0.00 8.39
0.00 0.00
0.00
o0,,o0o0
0.00
o0oo....oo01o0a4
0.00 0.0~

5 Pages 41-50

▲back to top

5.1 Page 41

▲back to top
TABLE 12
Corimerciat &Artisanat fisheries sunmary
COMMERCIAL AND ARTISANAL
PRODUCTION
CENTRAL DIVISION MARKETS
Suva
Navua
Nausori
Korovou
WESTERN DIVISION MARKETS
Sigatoka
Nadi
Namaka
Lautoka
Ba
Tavua
RakiRaki
NORTHERN DIVISION MARKETS
Labasa
Sub - total (a)
Fresh Fish
Non - Fish
Smokd & Sal td Fi sh
Weighted mean price
Weight(Mtl vatue($000l
----------------------
Weight(Mt) Value($000l
------------------- . -
W--e-i-g-h-t(-M--t)--V--a-l-u-e-($-0-0--0).
Fish($/Kg) S/S/F($/~g)
----------------------- '
0.00
'9.35
31.89
1. 41
0.00
52.39
98.80
3,75
297.63
27.88
168.72
8.09
227.33
12.33
150.58
3.37
est(0.5)
0.16
1.61
0. 10
est(2.00)
0.48
7.25
0,39
NA
4."00
2.71
3.00
3. lO
4,50
2,66
3.90
3.63
13 .30
20.98
13.35
0.64
2.84
96.04
284.76
80.22
78.52
0,69
3.70
11.85
36.72
0.00
0,00
0.00
0.00
179.77
564.18 190.91
144.86
0.63
3.36
106.85 316.18 123.92
96.25
0.34
1.71
49.46
136.86
69.27
49.48
0.43
2.09
35.82
100.33
29.85
24.96
0.03
0.14
3.66
4.44
2, 97
5.36
3.10
NA
3.14
5.33
2. 96
5.03
2.77
4.86
2.80
4..67
82. 33
171.64
32.18
618.40 1,778.91 1,049.65
67.90
868.93
20.74
-
25.37
90.86
112 . 82
2.08
4.38
2.88
4.45
CENTRAL OIV[SION OUT(ETS
Nabukulau Creek
235.92
823 . 16
40.51
96.24
0. 09
0.35
Laqere
128.79
416.83
4.97
35.52
Roadsides
765.48 2,741.67 254.20
148.31
Hotels Rests &Cafes
88.85
310.94
10.11
86.69
Butchers &Fish dealers 738.04 2,583.04
0.57
4.89
Shops &Supennarkets
501.14 1,753.99
9.94
80.50
Auxi l lary Unit
81.57
171.37
3.54
19.71
WESTERN DIVISION OUTLETS
Roadsides
Hotels Rests &cafes
Butchers &Fish dealers
Shops &Supermarkets
256.55
357.61
62. 50
114.27
687.58
1,037.04"
181. 25
331.33
45.14
71.34
0.06
1.56
200.99
621.56
0 . 54
14.19
NORTHERN DIVISION ·OUTLETS
Hotels Rests & cares
Butchers & Fish dealers
Shops &Supermarkets
Auxi llary Unit
14.80
572.60
104.02
101.87
33. 57
1,298.93
236.20
217.04
1.10
97.87
10·,55
7,57
6.37
499.92
62 . 47
26.73
Sub - total (bl
Grand total Cal+(bl
4,124 .01 12,823.93 559.33
4,742.41 14,602.84 1,608.98
1,904.63
2,773.56
0.09
25 .46
0.35
113.17
S/S/F = Smoked & salted fish

5.2 Page 42

▲back to top
TABLE 13
FISHERIES SECTOR IMPORTS TO FIJI, 1989
TABLE 14
FISHERIES SECTOR EXPORTS FROM FIJI - 1989
Item Description
Unit Quantity
Value
Unit Val
OTHFFE1iRsshhiE.nnXgePOttgR1TenSagrOF INTEREST (Kg)
5.03
50
zaB 10.80
OTHER IMPORTS OF INTEREST TO THE FISHERIES SECTOR
Fi:;h Liver oj l
otner t1s.J:l 01 £
n~ade fish.nets
; <sn:r1arn;iigc ot1est1f1111n9l!ts
gn utt ~uaar~r ss p<>e~g~l\\wsJ
F1es ar uvnsesse s
!NNNoooo....l
\\./or2 ~1es r1 u_ngepaar rts
1vorv,· shell,
Trochus but tons
GRANO-TOTAL-(ALLJ
16,140,501
------
TABLE 15
FISHERIES SECTOR RE-EXPORTS FROM FIJI - 1989
Item Description
Unit Quantity Value Unit Val
B~reare~hsnapper
smo f fish
Cang a Squ1
Cann~
F1s 1n
mp1naetckthse.arer
F1s ini netting
Nafura nets
8 Ocuuttuarr~spe<~ ~\\sJ
3gFrJ s~ei, ~oral etc
I
[NNoo. .l
~:~
~
,1!~!:\\,.~~
:rn
1~88:~6

5.3 Page 43

▲back to top
HAWKSBILL TURTLE
11TAKU 11
The hawksbill turtle or taku (Eretmoche/ys imbricata) is one
of the two 11common11 turtles in Fiji, together with the green
turtle (Chelonia mydas), and has a very significant place in
Fijian culture. In previous years turtles were reserved for
chiefly use, and this is still the case in certain areas. How-
ever, turtles are by no means as common as they once
were, and rural peoples are now hard-pressed to catch
enough turtles to fulfil traditional obligations.
The Hawksbill turtle is a topical issue because of the recent
escalation in exports of raw turtle shell from Fiji, which fur-
ther threatens the resource. Many countries have now pro-
hibited the export of raw turtle shell and the importing na-
tions (mainly Japan) are now having to concentrate on just
a few sources of supply.
Turtles are much slower growing than was once thought.
For example, Green turtles are now estimated to take 25 to
30 years to reach sexual maturity, which makes it even
more necessary for fishermen to limit their catches. In Fiji, it
is illegal to catch turtles in the months of November, De-
cember, January and February, and it is illegal to take or
even disturb turtle eggs at any time.
Turtle culture is not likely to solve the problem. Turtles do
not easily breed in captivity, and grow very slowly. The
hatching of eggs collected from the beach, under pro-
tected conditions, has never been proved to be of assist-
ance in increasing wild stocks. The only reliable answer is
to reduce our catch before it is too late.