FFD_AR_1987

1 Pages 1-10

▲back to top

1.1 Page 1

▲back to top
.,,,./
,
~
II.I
I BHERIES
DI IOI
~
IBBl

1.2 Page 2

▲back to top
.t}
wES
D
I/ I S I O N
,11°
NOA T H
.
--------------~
D'
I
_,I
I
' - - - - - - - - - - 'I
,
I-
()
(PAFCO)
UKA
K0
A
0
sEA
0
~
e - OFFICE·
• - ICEPLANT
~
....,.,...._,...
"'
.,
0
'I
180
•• .,,
Q LAKEBA
q
0
EAS T ERN
0IVISIO N
,,
,,
179"
179°

1.3 Page 3

▲back to top
ANNUAL REPORT 1987
CONTENTS
1.
INTRODUCTION .................................................................................................................................................................................1
2.
THE FISHING INDUSTRY ........................,...............................................................................................................................2
2.1
THE INDUSTRIAL TUNA FISHERY .........................................................................................................2
TUNA LANDINGS
2.1.l
POLE AND LINE VESSELS ..........................................................................................................2
2.1.2
LONGLINE VESSELS.............................................................................................................................2
2.1.3
PACIFIC FISHING COMPANY .....................................................................................................2
TUNA PROCESSING AND SALES
2.1.4
CANNED TUNA .................,.....................................................................................................................3
2.1.5
FISHMEAL PRODUCTION ................................................................................................................3
2.2
THE ARTISANAL FISHERY .....................................................................................~..........................3
2.2.1
4\\?-W.~. . . . . . . . . . . . . PRODUCTION .............................................................................................
~
2.2.2
2.3
v -.................................. ·:~S··"'......................... MARKETING ........................,...........................................~
4
THE SUBSISTENCE FISHERY .".................................
4
2.4
AQUACULTURE .....................................................~....................................................................................4
2.5
EXPORTS f!j;-f:. ........................................................ . . . . . . . . . . . . . . . . .. . . . . . . . . . . . . . . . . . . . . . . . . . . . . . . ,....5
2.6
-(5 IMPORTS................................................ ,. ................................................................................................................5
2.7
SUMMARY OF TOTAL FISH PRODUCTION..................................................................................5
3.
THE FISHERIES DIVISION .......................................................................................................................................................7
3.1
ADMINISTRATION ............................................................................:..........................................................................7
3.1.1
PERSONNEL ................................................................................................................................................ 7
3.1.2
AID PERSONNEL......................................................................................................................................7
3.1.3
TRAINING.........................................................................................................................................................7
3.1.4
FINANC::E ...........................................................................................................................................................9
EXPENDITURE
REVENUE
3.1.5
VESSELS .. ..... ............................ .. ........ .. ..... ........ .. .... ..... ... ... .. ............................................. ... ..................... .. .. .....9
3.1.6
VEHJCLES .......................................................................................................................................................... 9
3.1.7
BUILDINGS & PLANT ........................................................................................................................ 10
3.2
TECHNICAL SERVICES/EXTENSION ............................................................................................................ 10
3.2. l
BOAT BUILDING PROGR.(>i.MME ...............................................................................................10
3.2.2
FIJI DEVELOPMENT BANK LOAN ASSESSMENT ................................................10
3.2.3
FISHING GEAR SALES .......................................................................................................................10

1.4 Page 4

▲back to top
3,2.-4
3.2.5
3.2.6
3.2.7
3.3
3.4
3.4.l
3.4.2
3.4.3
3.4.4
3.4.5
3.4.6
3.4.7
3.4.8
3.4.9
3.4.10
3.4.11
3.4.12
3.4.13
3.4.14
3.5
3.6
ICE PRODUCTION .................................................................................................................................. 10
REGULATORY WORK......................................................................................................................... 11
FISH PROCESSING UNIT ..................................................................................................................11
TRAINING ......................................................................................................................................................... 1J
&:XTENSION SERVICES............................................................................................................................................12
RESOURCE ASSESSMENT AND DEVELOPMENT ....................................................................... 12
COLLECTION OP PRODUCTION DATA .......................................................................... 12
CATCH STATISTICS ............................................................................................................................ 12
FISHERY RESOURCE MANAGEMENT ................................................................................. 12
COASTAL ZONE MANAGEMENT ..........................................................................................12
FAD DEPLOYMENT.............................................................................................................................. 12
DEEPWATER SNAPPER .............................,......................................................................................13
GIANT CLAM PROJECT ..................................................................................................................13
SEAWEED CULTURE .......................................................................................................................... 13
FRESHWATER FISHERIES ................................................................................................................ 13
AQUACULTUB.E
MACROBRACHIUM CULTURE ....................................................................................................13
PRODUCTION OF MAJOR CARPS ........................................................................................13
RED TILAPIA ............................................................................................................................................. 14
RURAL AQUACULTURE PROGRAMME ........................................................................... 14
GREEN MUSSEL CULTURE ...........................................................................................................14
INFORMATION AND LIBRARY SERVICES........................................................................................14
INTERNATIONAL LINKAGES ........................................................................................................................... 14
LIST OF TABLES
Table 1. PAFCO LANDINGS....................................................................................................................................................................2
Table 2. FISHERMEN BY DIVJSION.................................................................................................................................................3
Table 3. VESSELS BY DIVISION.........................................................................................................................................................3
Table 4. LOCAL FISH PRODUCTION............................................................................................................................................6
Table 5. STAFF STRUCTURE...,.............................................................................................................................................................8
Table 6. DIVISIONAL EXPENDITURE......................................................,........,.............................................................................9
Table 7. DIVISIONAL REVENUr:-..........................................................................................................................................................9
Table 8. FISHING GEAR SALES.......................................................................................................................................................... 10
Table 9. ICE PRODUCTION...................................................................................................................................................................... 11

1.5 Page 5

▲back to top
Fltherlet 1987
I. INTRODUCTION
Th.is report provides details of fisheries sector production during the calendar year 1987, together
with a summary of the activities of the Fisheries Division during this period.
1987 was the second year of the Development Plan 9 period (1986-1990} The major thrust of
Government policy during DPS was to encourage fisherfe~ development for subsistence. commer·
clal 11\\d industrial purposes. The objectives of the fisheries sector during DP9 are to:
• generate further employment opportunities in the exploitation and processing of marine
products.
increase production to satisfy local demand for fish and other marine fr,h products,
increase value adde~ to fish production for export.
• re1ulate and control tlie exploitation ot tin and non· tin tlshery products.
Despite political upheavals. DP9 remains our guideline. although it is obvious that some changes
in emphasis will be necessary. Cuts in government funding and overseas aid during 1987 re·
duced capital works in the provision of dipways and other infrastructure for the small·scale ar·
tisanal fishery, and the upsurge Jn exploitation ot Inshore resources, particularly tor the export
trade. will necvssita.ta a hilber level of resource assessment activity.
Durinr; 1987 small scale commercial (artisanal) fisheries production increa.sed by 8.5% to 6,665
tonnes, and the value increased by 26.7% to approximately PS 13.2 million. Increases in both fish
and non·fish production were recorded, altbour;h NMA local sales stood at 51% of 1986 level~.
In the industrial sector. the local tuna. catch increased by 43% to 6,246 tonnes, due both to
100d performance from lka Corporation and inaeased activity from licensed foreien longliners.
The PAFCO tuna cannery at Levuia increased its throughput yet again (to 11,079 tonnes) and
sold a record F$26 mUllon worth ot canned tlsh, mainly to the export market.
The deepwater snapper industry (producing hlgh·quallty chilled tish for the US market) conli·
nued to develop. but the big surprise of the year was the new demand tor low-quality beche·
de·mer in south-east Asia, which pushed exports up from 230 tonnes in 1986 to 640 tonnes in
1987. The buddin1: seaweed industry had some hiccups in 1987 and fell well short of the 600
tonne export tarcet, due mainly to trade bans by New Zealand, but the final production was a
creditable 217 tonnes, up 25% on 1986.
The economic hardships of 1987 have forced many people to tum to fishinr; to maintain their
livelihood. It is the tad: of the Fisheries Division to channel this efto1t, and to make sure that
the more vulnerable inshore resources are not overfished. Further commercial development should
ideally be concentrated on the outer·reet and oceanic tlsherles. and the Division must make fish·
ermen aware of the possibilities and provide support in the form of training. vessels, infrastruc·
ture and fish·122ree:alion devicvs. Aquaculture is another approach, with impressive 2rowth · pros·
pects, and of particular benefit to the inland population, but which needs a lot of development
work.
1988 will be a. particularly challen2in2 year for the Fisheries Division.

1.6 Page 6

▲back to top
2.1 THE INDUSTRIAL TUNA ASHERY
Fl:aherl•• 1987
2. THE FISHING INDUSTRY
The Fishing Industry is 11:enerally divided into four primary sectors, although the distinction be·
tween these is becoming less clearcut as they develop and diversify. They are:
• The industrial fishery, which operates on a large scale and is primarily export oriented.
This involves mainly the PAPCO tuna cannery at Levula, and tuna captur.e and sup·
ply by both local and overseas vessels. The deep water snapper fishery is now start·
ing to fit into this category.
• The artisanal fishery. This sector includes most small scale commercial p1oduction for
domestic sale. It is a significant source of domestic fish-supply and employment.
• The subsistence fishery, involving catches for self· consumption. with the occasional
sale of surplus catch.
• Aquaculture is receiving increased attention in Fisheries development, but remains large-
ly experimental. Aquaculture has the advantage of not beine; based on limited natu·
tal fish resources, but requires a comparatively lat&e investment.
2.1 THE INDUSTRIAL TUNA FISHERY
TUNA LANDINGS
2.1.1 POLE AND LINE VESSELS
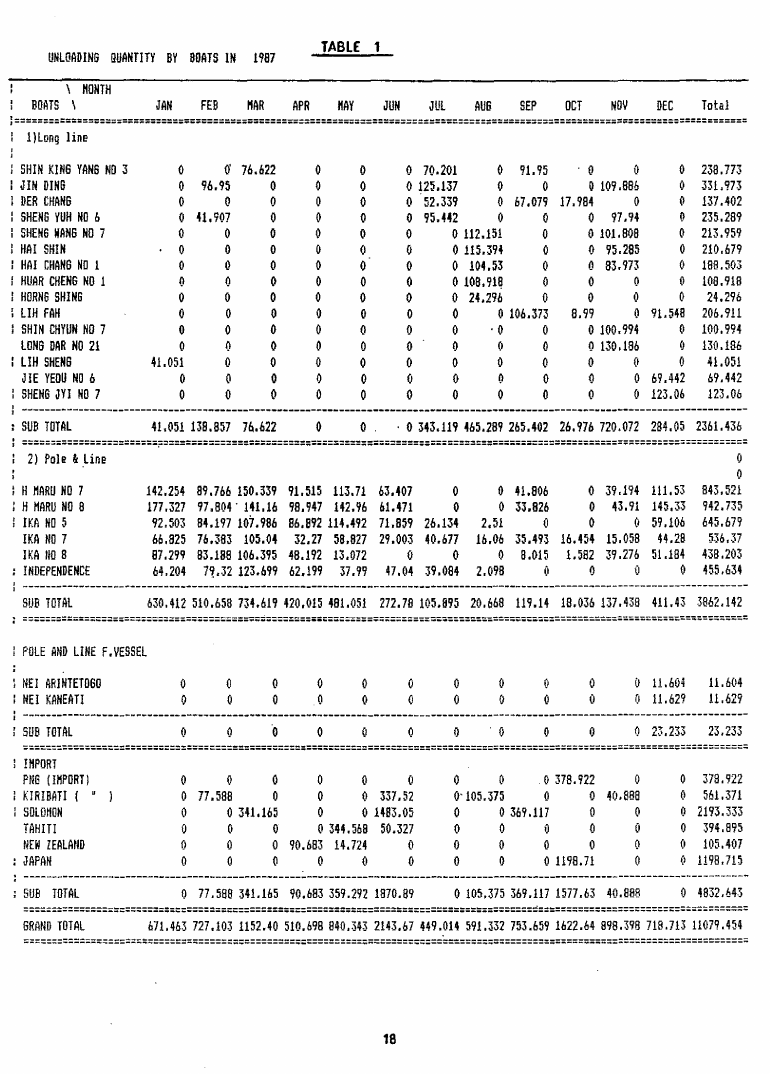
The IKA Corporation fleet of 6 vessels, 3 IKA owned, 2 chartered Holmlr.u Marine and 1 othe1
privately owned continued to fish in Fiji waters. !KA 5 was out of fishing for almost 3 months.
2 pole and line vessels from Kiribati also unloaded 23 tonnes of tuna (caught in Fiji waters) in
1987
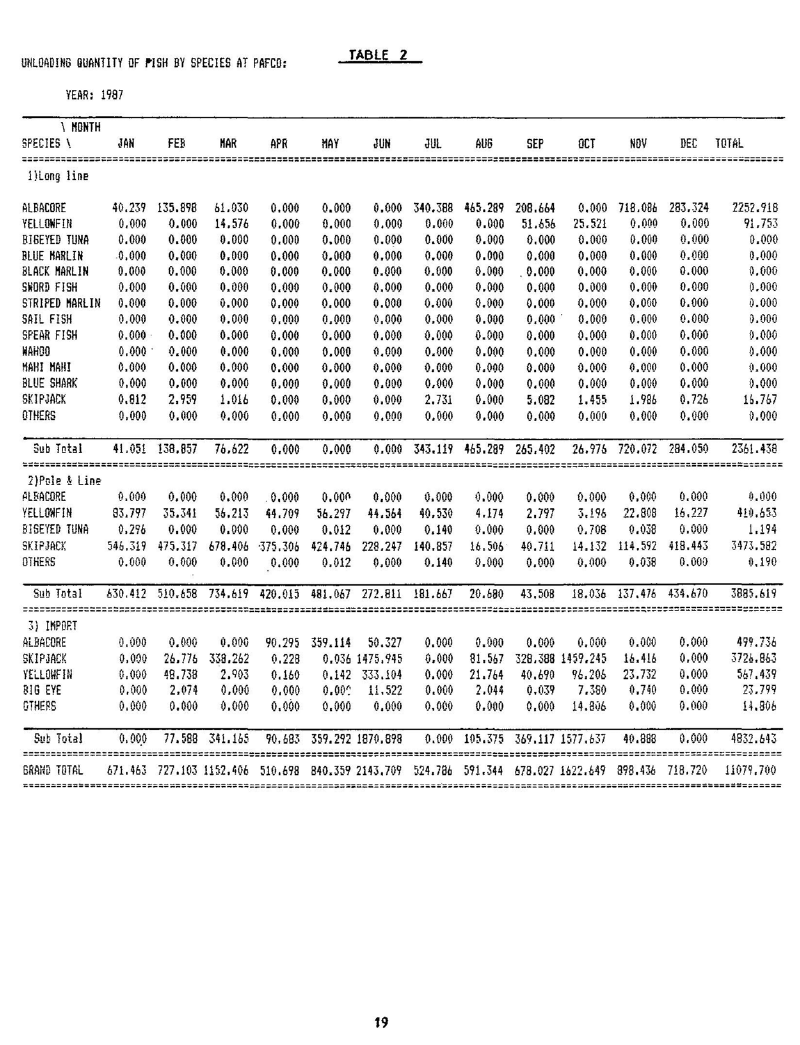
A total of 3,885 tonnes of tuna was landed and sold to Pacific Fishing Company for J2.8 mil·
fun (see Appendix I for details). This was a 25% increase in pole and line landings over 1986.
2.1.2 LONGLINE VESSELS
A total of fifteen Taiwanese longline vessels were contracted by PAFCO during 1987 Total
landings of fish were 2,361.44 tonnes. Landin2s were up by 91 % compared to the 1986 catch
of 1,237.2 tonnes.
2.1.3 PACIAC ASHING COMPANY
PAFCO received a total of 11,079.08 tonnes of fish in 1987, the highest volume ever on rec·
ord. Nearly half of this was imported pole and line fish from regional countries (mainly Solo·
morts). but a levelling -off in the previous trend towards increased import involvement wa,; ob-
served. Total landings at PAFCO increased by 7.8% compared to 1986.
Table 1 PAFCO LANDINGS
(See Appendix Tables I and 2)
2

1.7 Page 7

▲back to top
2.2 THE ARTISANAL ASHERY
Fisheries 1987
TUNA PROCESSING AND SAi.ES
2.1.4 CANNED TUNA
A total of 706,860 cartons (48 x 7oz equivalent) of canned fish weie produced; an increase of
17% over 1986. Durini: the year, 669,943 cartons of tuna valued at $25.8 million were exported
(including 153,000 cartons of petfood), and 17,634 cartons valued at $373,811 were sold locally.
PAFCO also exported 926 tonnes ot raw fish valued at S2.95 million.
2.1.5 FISHMEAL PRODUCTION
In 1987, 1,118 tonnes of fishmeal were produced, a 45% increase over 1986. Most (1,005 ton·
nes) was sold locally tor $542.109. The 54 tonnes remainder was exported for $28,487.
2.2 THE ARTISANAL FISHERY
The artisamd (small-scale commercial) fishetiei sector is an "increasini:ly diverse one, ranging from
village fisherwomen collecting shellfish in rivers, to larger vessels fishing offshore for deepwater
snappers for export. Production data for this sector is collected by the Fisheries Division and all
persons taking fish by way of trade or business are requited, under the Fisheries Act, to ab·
tain a license. Table 2 lists the number of licensed fishermen by administrative division and
Table 3, the number and type of licensed fishing vessels per Division. This serves as a crude
index of the level of artisanal fishing activity.
Table l. FISHERMEN BY DIVISION - 1987
ota crew
ODA · Outside demarcated (customary fishing rights) areas
This is a reduction in license issues ot 9% relative to 1986, mainly due to fewer license issues
in the Central Division
Table 3. VESSELS BY DIVISION - 1987
2.2.1 PRODUCTION
An estimated 4,737 tonnes of fresh or frozen fish worth $) 1.46 million were sold through vari·
ous outlets in 1987, an increase in weight by 9.2%, and an increase in value by 32.5%, over
1986, The predominant fish families in the catch were emperors (le/lJEinAic1f!,.l · 864 tonnes, mul·
lets (Mug-JlJo,1e) · 578 tonnes, mackerels & tuna (.S"comb.i.k/,1'!,} 542 tonnes, and groupers (.)1>J·
3

1.8 Page 8

▲back to top
2.3 THE SUBSISTENCE ASHERY
Aahertea 1987
fiU/Milt') · 497 tonnes. These 4 categories toeether made up 52% of the total arlisanal fish catch
(see Appendix Table 8} Figures on production by area are difficult to obtain, but about 55% of
the fish was sold in the Central Division.
Non ·fish sales (ie. shellfish, crustaceans, molluscs, holothurians, seaweed etc.) totalled 1,927 tonnes,
worth Sl.8 million. This was an increase of 6.8% by weight and a deaease of 1.8% by value
over l986. The freshwater tal (B,,IJSS4 spp) accounted tor 73%. of this production by volume,
with mangrove crabs (.><y./h spp.) · 138 tonnes · and rod lobster (P,vtuliru.~ spp.) · 32 tonnes
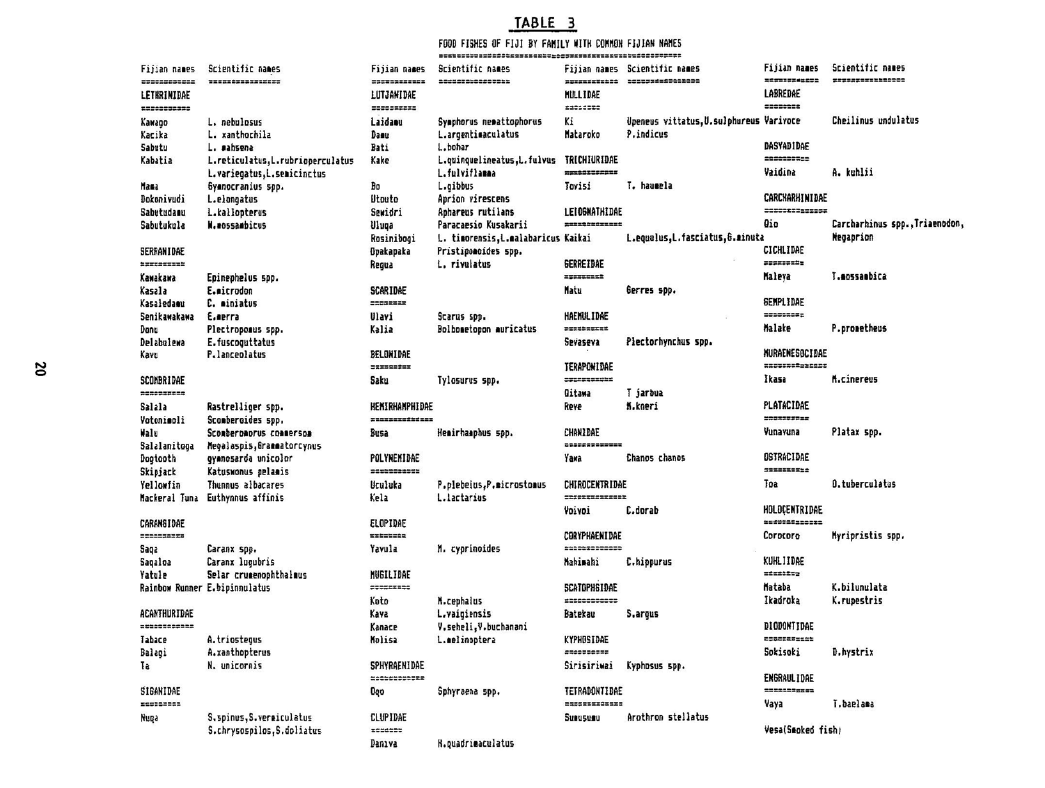
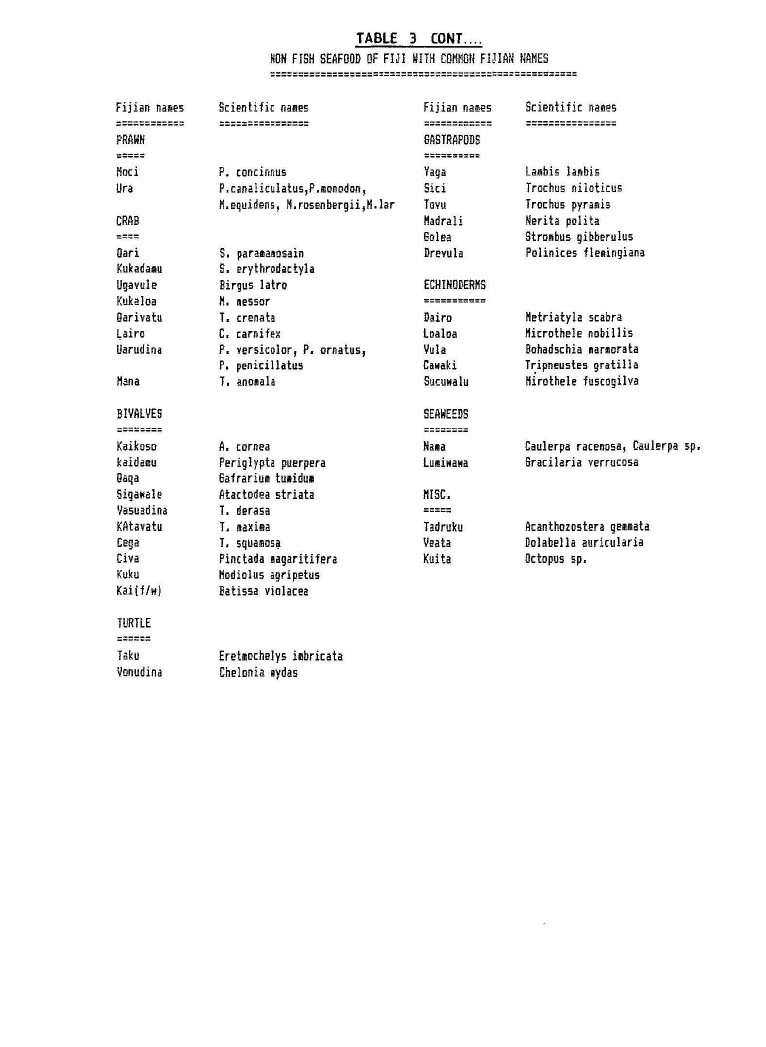
· amtributing disproportionately to the total value (see Appendix Table 9). Appendix Table 3
provides a guide to common Fijian fish and non·fish names.
2.2.2 MARKETING
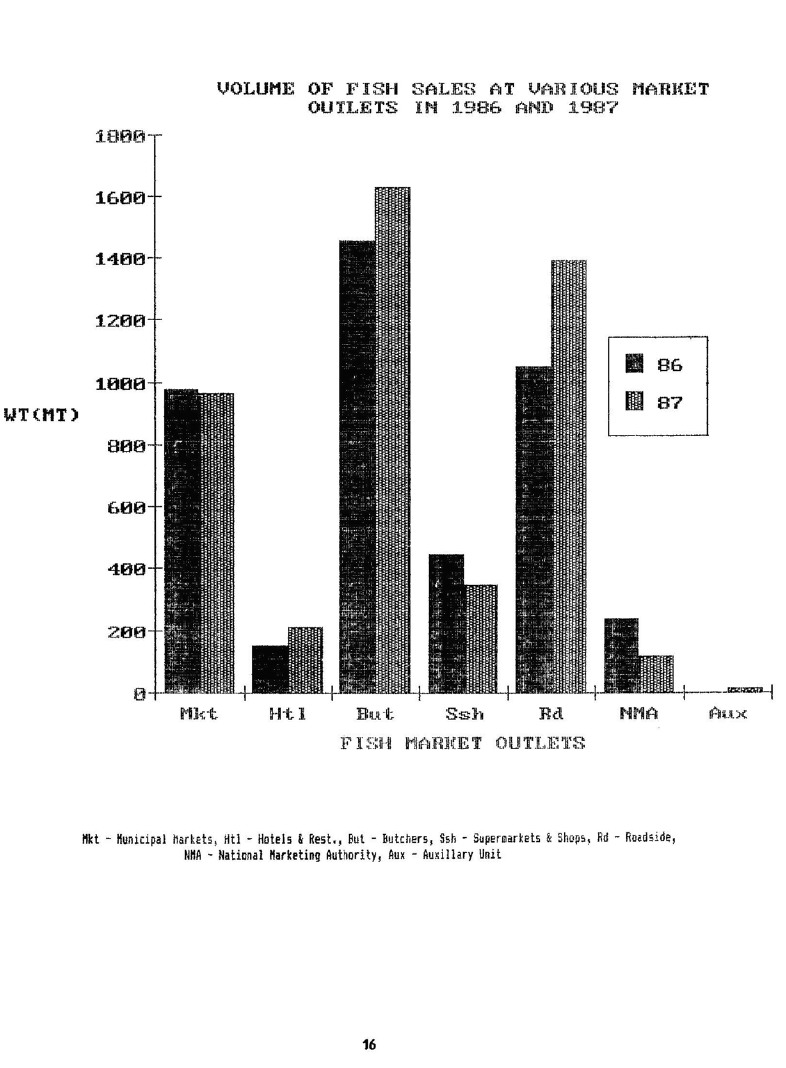
The product is sold through a variety of outlets which can be broadly grouped into six ca·
tegories as follows:·
• Municipal markets
• Hotels
• Restaurants and Cates
• Butchers and Fish Merchants
• Retail shops and Supermarkets
• Roadside stalls and the National Marketing Authority
Price information ls obtained by interview tor market sales. but is not generally available tor
other outlet categories other than NMA.
The relative importance of these various outlet categories varies by Division, as Appendix Table
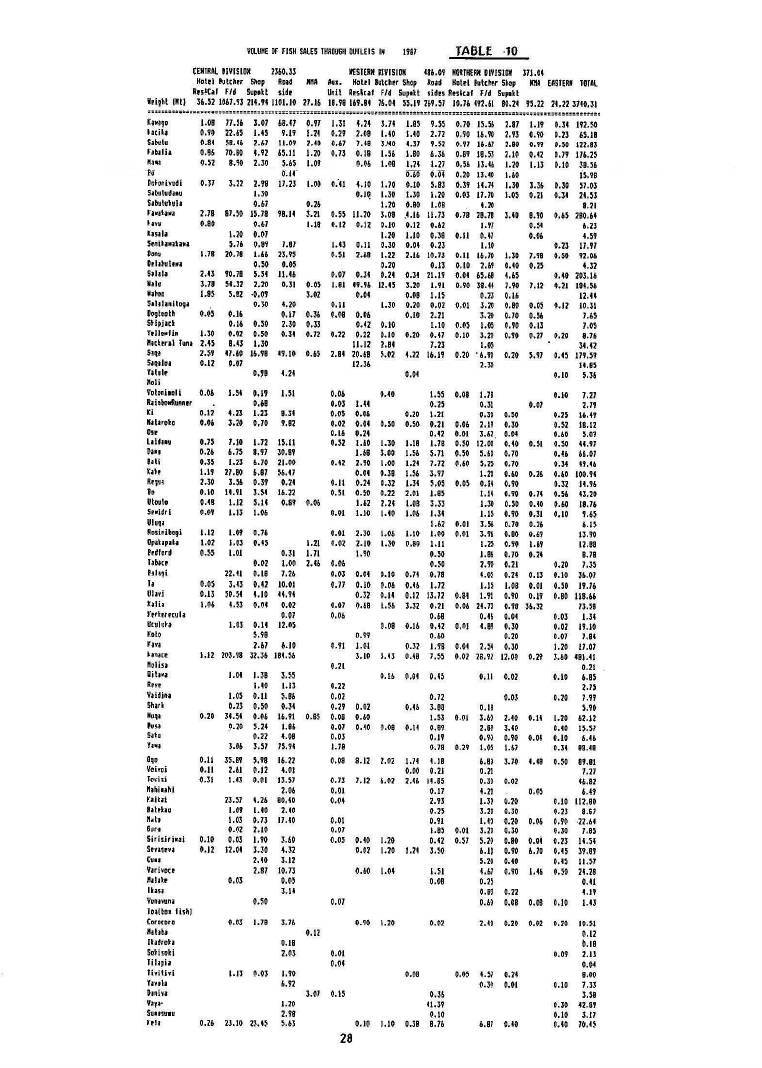
12 demonstrates. Notable features are the importance of the unique wholesale butchers in the
Central Division, municipal markets in the Western and Northern Divisions, and roadside sales
in the Western Division.
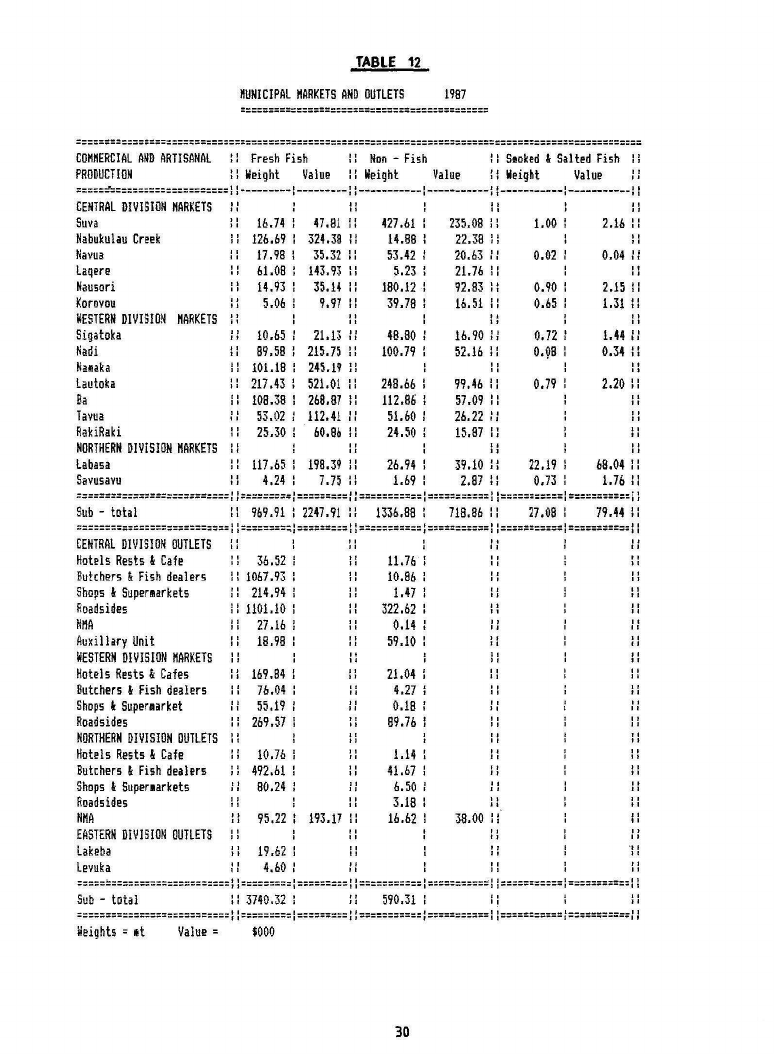
Sales of fish throu1h Municipal Markets have steadily declined, particularly in the Central Divi·
sion. In the No1tbe1n Division also, increasing quantities of fish are diverted to Central Division
outlets for sale. Only 21% of fish sales were made through Municipal Markets in 1987 (com·
pared with over 40% in 1981) although this market share appears to now be steady. On the
other hand, municipal markets still handle most non ·fish sales (69% share). although this is over·
whelrnin1Iy kai.
Weighted mean prices for. most products have shown relatively small increases from 1982 to
1986, but the latter part of 1987 appeared to presage a s]i2:htly hi2her rise in price. The total
average price of fish for 1987 was 15% higher than 1986. Rises were experienced by many of
the more valuable non ·fish products, a.lthou"h hie;h · volume staples, such as kai, remained at
1986 levels.
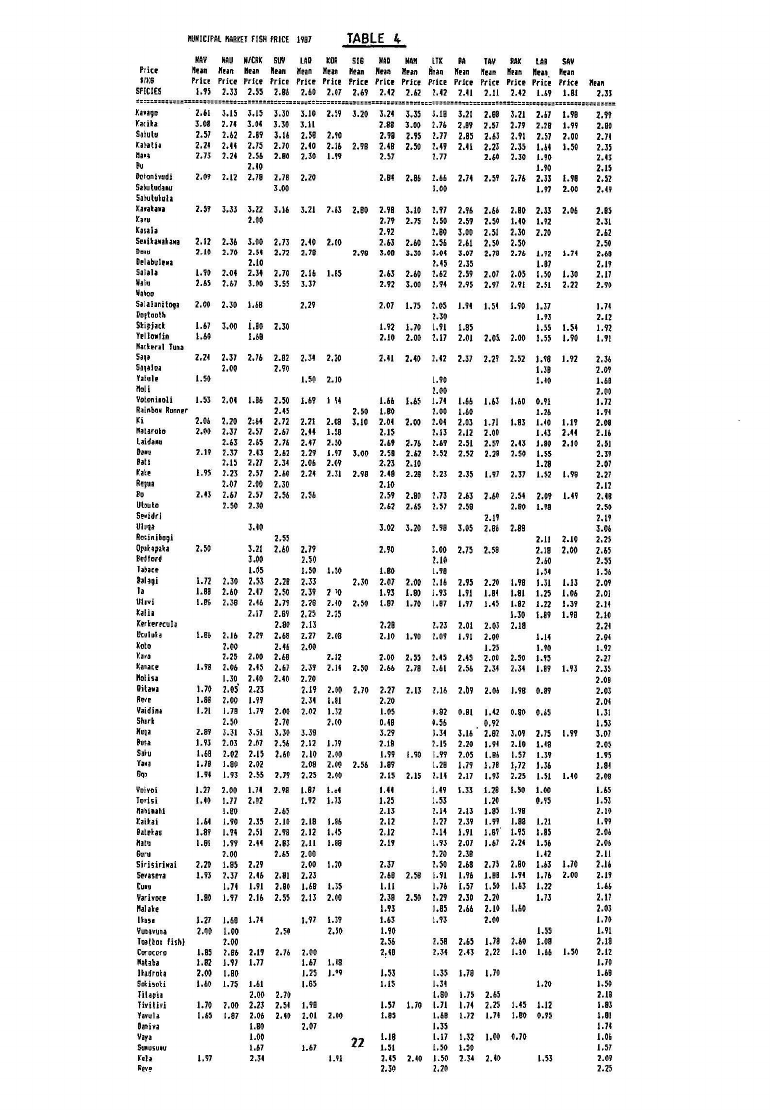
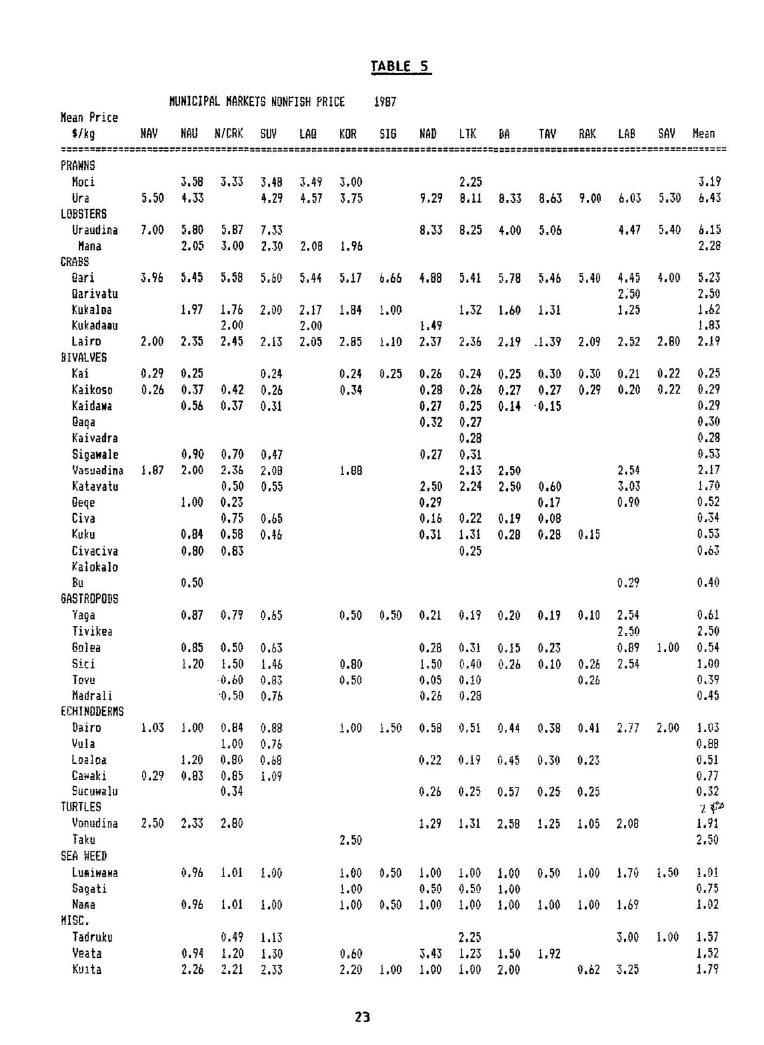
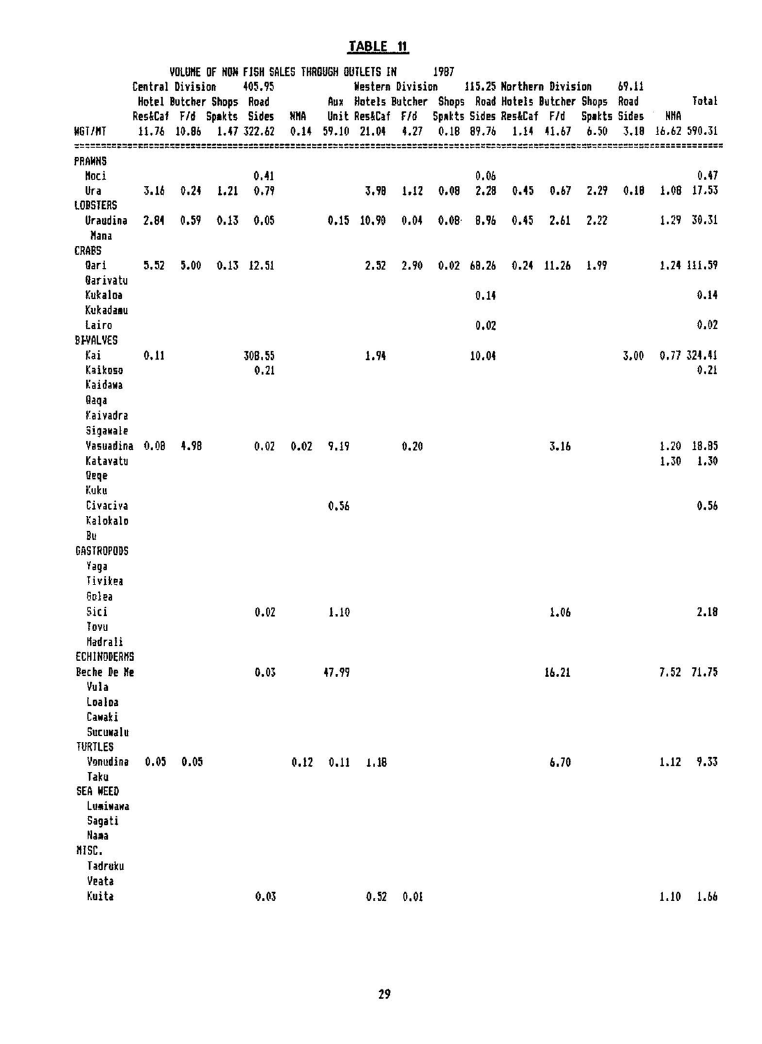
Appendix Tables 6 to 11 provide details of arlisanal fish and non·ftsh producilon for 1987 in
municipal markets and other outlets.
2.3 THE SUBSISTENCE FISHERY
Reliable estimates if the subsistence catch (fish and non ·fish) ue not available. An estimate of
14,000 tonnes per annum, obtained in 1980 from an interview survey of approximately 9% of
Fijian coastal villages, is normally used, with an annual increment of 200 tonnes.
2.4 AQUACULTURE
The Raviravi prawn farm. operated by a Fiji Development Bank·France Aquaculture joint ven·
ture, Prawns (Fiji) Ltd., produced 7.7 tonnes of penaeid prawns (P,,ir(y.lirt1Slru and P,monodon)
durinr 1987, well below the projected tar2et which suggests that 70 tonnes is possible from the
4

1.9 Page 9

▲back to top
2.5 EXPORTS
Flaherlet 1987
existin2 area. The joint ventute is presently under review, and it is necessary to expand the
present pond area to cater for export volumes, now that water-quality problems have been over·
come. for the project to become a commercial success.
900 kg of .M,,crnoroc/JJi1m JnsenblYgii prawns were produced during el(perimental culture at the
Fisheries Division's Nadurnloulou Research Station and the Division will be looking to promote
small-scale commercial trials of this species in the coming year.
217 tonnes of dried .li'11dJe11m11 seaweed were exported to New Zealand for final processing dur·
ing the year,
2.5 EXPORTS
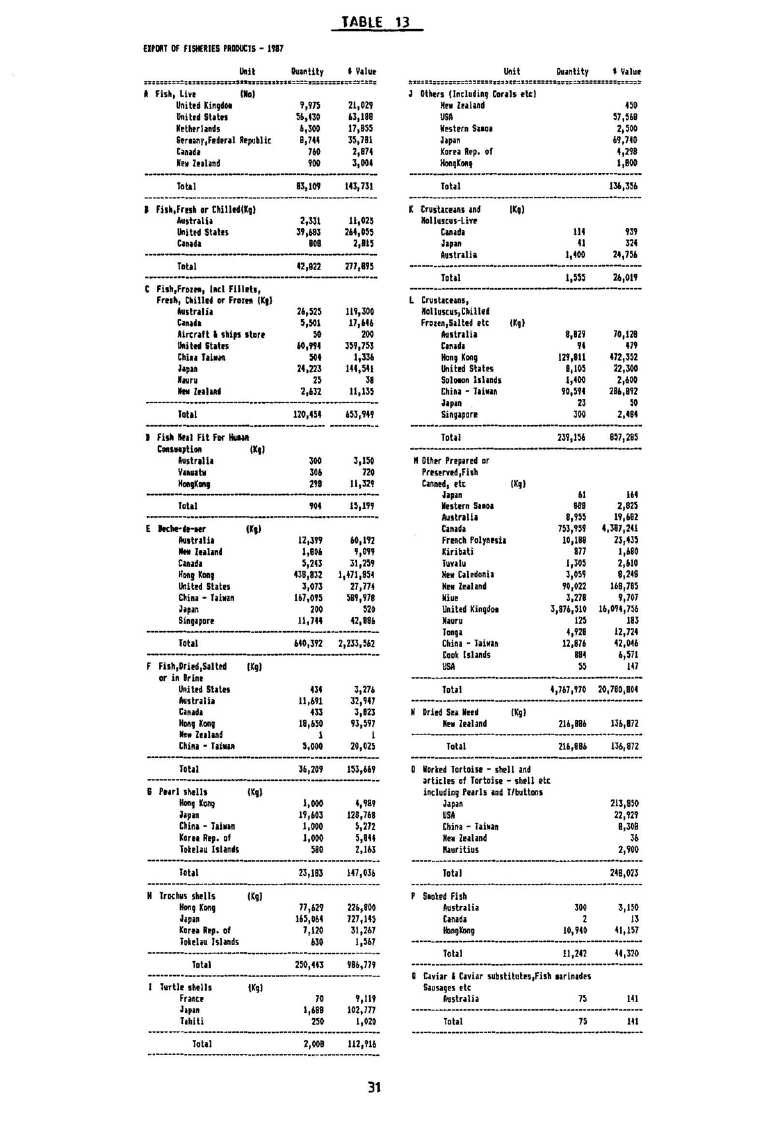
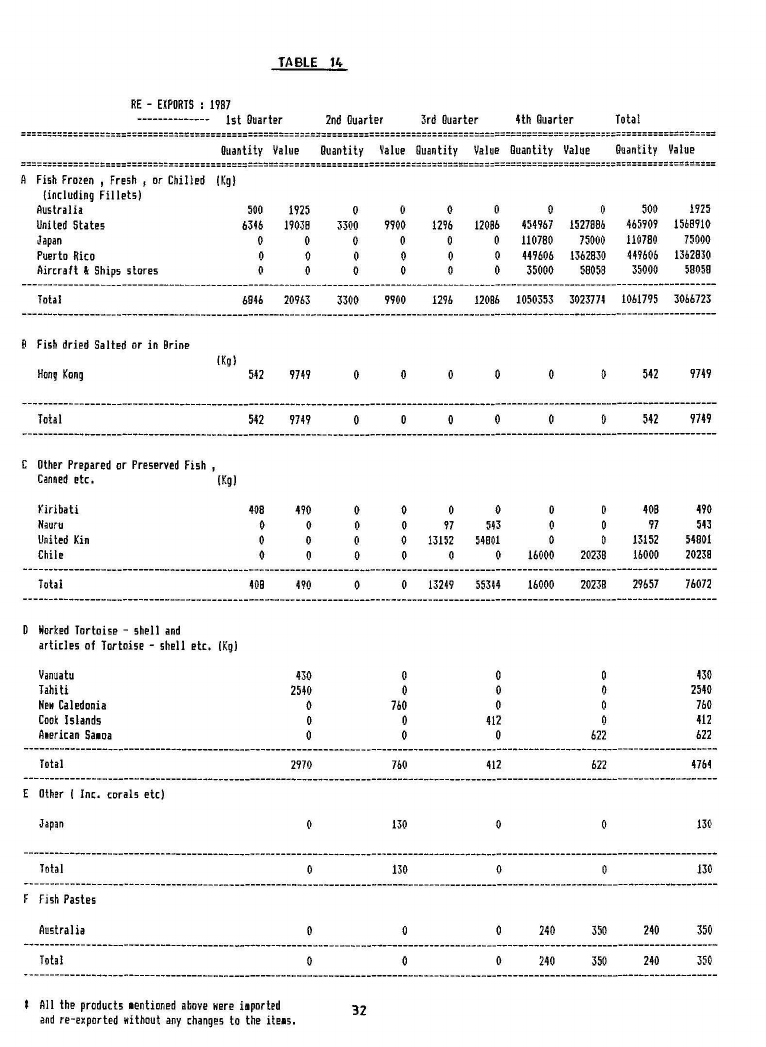
Exports were dominated by canned tuna (669,943 cartons, valued at S25.8 million) but included
increasing quantities ot live tish (83,109 valued at $143,000). fresh or frozen fish (mainly deep·
water snappers: 163 tonnes, an 83% increase over 1986). beche·de·mer (mainly driloli: 640 ton·
nes, a 180% incre.ue). trochus shells and buttons, ornamental corals and seaweed. Appendix Ta·
bles 13 and 14 list the Bureau of Census and Statistics figures for exports and re-exports from
Fiji Of those ca.tee;ories sutveyerf, exports totalled $26.95 million (a 40% increase over 1986) and
re-exports totalled $3.16 million~
However, the Buteau of Census and Statistics fisheries export breakdown is not yet fully ration'·
ali.sed. Some fishery produch are incorporated into agricultural cateeories, 01 otherwise cryptically
classified. Our own figures. from various sources. (see Text Table 4 · Total fish production sum·
mary) suggest that the value of exports approaches S34 million. This is a 51% increase on our
own figures for 1986.
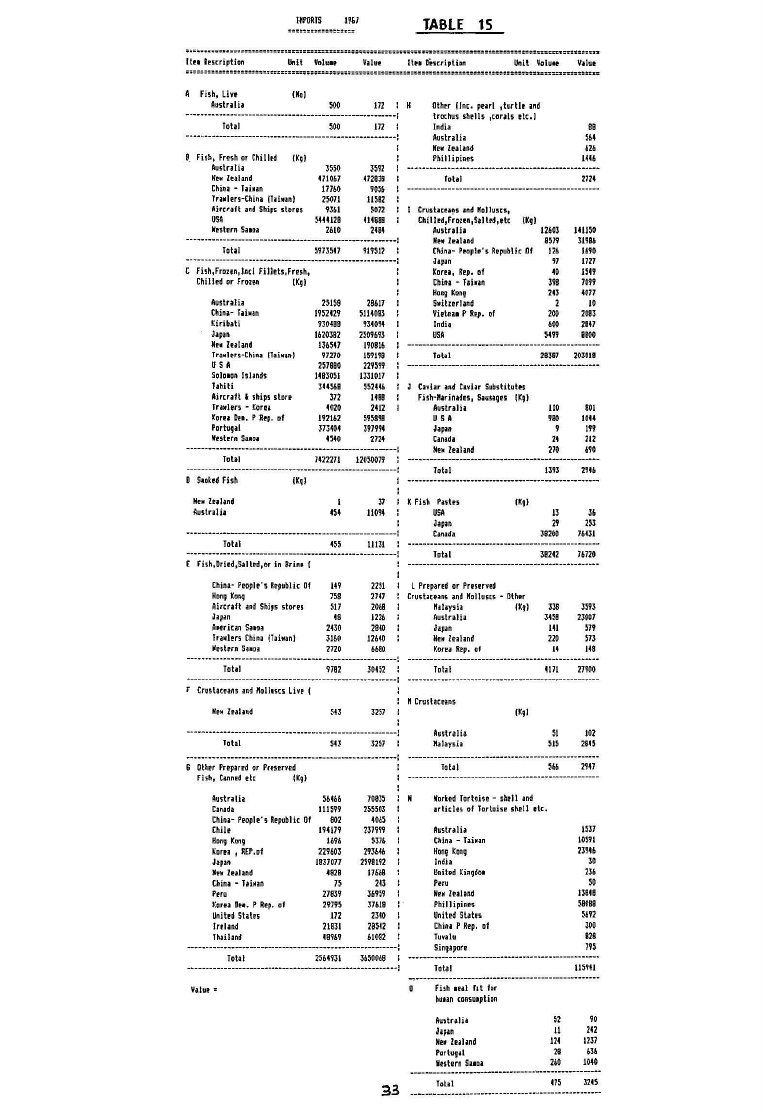
2.6 IMPORTS
Appendix Table 15 lists the Bmeau of Census and Statistics figures for imports into Fiji dur ·
ine: 1987. The total value of those fishery products listed was Sl7,l million (a 7.4% increase over
1986), of which the largest pa.t was tuna and mackerel to supply local canneries.
2.7 SUMMARY OF LOCAL FISH PRODUCTION
Table 4 summarises local fish production (both for local consumption and export) over the years
1982-1987, Artisanal fish production has increased by 42% in that period, and non·fish produc·
tion by 20~, although both showed a slight downturn in 1987.
5

1.10 Page 10

▲back to top
TABLE 4
SUHHARY OF LOCAL FISH PRODUCTION 1983-1987
CLASSIFICATION
1983
1984
1985
1986
1987
Wgt Value llgt Value Wgt Value Wgt Value Wgt Value
tonnes $1000 tonnes $1000 tonnes $1000 tonnes $1000 tonnes $1000
-=--===============================================================================:=================================---
ARTISANAL FISH
Hunicipal Harkets B40.60 1575.80 925.30 1b25.20 980,93 1638,20 963.11 1916. 59 . 969.9\\ 2247.90
HHA
290.60 365. 56 276.00 277.13 379.33 656.93 240.53 478.65 122.38 279,03
Other Outlets
2360.60 4484.30 2728,00 5353. 74 WH.04 5727,20 3113.77 6196.40 3617.94 8863,95
Saoked Fish
35.B2 123.13 21.30 43.99 27.30 61.00 16,33 35.93 24.95 67.23
Salted Fish
33.80 141.73 9.70 38.63 5,10 20.50 4.45 21.49 2,13 5.81
Sufi - total
3561.42
ARTISANAL NON-FISH
Nunicipal Harkets 1450.30
NHA ~ Other Outlets 502.90
6690,52
880.96
782.20
3960,30
1547.16
233.40
7338,69
766.39
910.37
4083,70
1175,70
423.3B
8103.83
643.83
359,40
4338,19
1259.18
544.55
8649,07
930,12
B56.11
4737.31 11463.92
1336.88 718.86
590.31 1035.21
S.,~ - total
1953.20 1663 ,16 1780.56 1676.76 1599 ,08 1003.23 1803.73 1786,23 1927 .19 1754,07
IHDUSlRiAL (TUNA) LANDINss----------------------------------------------------------------------------------------------
Pote & Line
5468.90 3426.20 4572.80 3900.00 3252.00 2325.10 3119.34 2220.00 3885.00 2800.00
Purse Seine
1006.00 894,20 577.26 436.80 693.00 497,10
LDllg Line
1384.22 5581.80 1832.90 2200.00 2105.60 3751.50 1237.20 1730.00 23b1.44 8400.00
Other {hport}.
368.00 381.83 1987,30 1594.30 2374.20 1620.50 5924,00 5224,62 4832.64 4400.00
Sul! - total
8227.12 10284.03 8970.26 8131.10 8424,80 8194.20 102B0.54 9174.62 11079,08 15600.00
Bait (Pole &Line) 114.56
95.18
57.20
59.70
50.00
==========================================================~===================================================----------
SUBSISTENCE (estit} 14600.00
1~800.00
15000.00
15200.00
15400.00
==============================================·======================================•=========================-=-------
PAFCD CANNERY PRODUCTION
Canned Fish (ctn) 551321.00
592484.00
436315.00
602281.00
706860.00
Fish Heal
741,40 312.80 682.18
6.52.18 324.70 771,00 394.45 1118.00
Local sales (ctn) 7034.00 71,.38 8678.00 116.B2 7400.00 108.86 8192.00 162.98 17634.00 373.B1
=====-~=-================;=========;:;===========:=========================================================-------------
EXPORTS by tonnage
Shark fin
7.70 61.62 8.00 64.00 10.B2 108.20 8.32 B4.36 6.33 44.33
Trochus
3H,10 576.90 340.10 646,19 274,00 534.30 233.66 738.99 250.44 9B6.78
HOP
22,30 80.28 23.60 84,9b 1b.10 56.00 12.34 45.12 23.18 147.04
Bee he-de-Her
32,90 394.80 53.70 451.35 66.20 660,00 229.38 B86.67 640.39 2233.46
Frozen Crab
1.50 12.00
0.04 0.18
Frozen fish -OTHERS 3.10 15.50 4,60 46.00 26.60 133,00 8B,77 309.66 256.21 117.37
-PAFCO 492.50 526,70 633,80 674.90 1823.00 3300.00 186.00 180,6B 926.03 2950.00
Chilled Fish
42.82 277.90
Dried Seaweed
173,41 135,29 216.89 136.87
Stoked Fish
0,04 0.11 11.24 44.32
Fish dried salted
29,BB 109.34
Crustaceans~ Nolluscs
240.71 8B3,30
Fish Heal
54.00 28,50
Others
16.35 380,59 2,08 113,06
EXPORTS in niscellaneous units
AquariuFish (no)
12866.00 2400.00 59404.00 96.48 71840.00 103.33 83109 .oo 143, 73
Canned Fish (ctn) 771470.00 1b41b,OO 589543.00 16088.50 450198.00 12497.10 615994,00 19500.00 669943.00 25780.00
Corals (pieces)
136.36
Worked shells
248.03
===============================================================================-----===========-------------------------
TOTAL YALUE OF EXPORTS
18083.80
20455.90
17385.26
21580.69
34380.39
========:================================================================================;==================------------
6

2 Pages 11-20

▲back to top

2.1 Page 11

▲back to top
3.1 ADMINISTRATION
Atherlet 1987
l. THE FISHERIES DIVISION
The Fisheries Division, of the Ministry of Primary Industries, has its headquarters at Lami, on
the western outskirts of Suva The four administrative Divisions of Fiji are the primary organi-
sational units, and Fisheries has Divisional offices in Lauloka (Westem Division), Labasa (North·
em Division). Nausori (Central Division) and Lami (Eastern Division). Respectively. these service
subsidiaJ:y offices in Rakiraki, Tavua, Ba and Sigatola (Westem), Taveuni, Savusavu and Nabou ·
walu (Northern) and Lakeba, Vunisea and Levuka (Eastern}
3.1 ADMINISTRATION
3.1.1 PERSONNEL
At the end of 1987, 1:0.5 · of the 117 established posts were occupied, fr·. ·posts are present in
Administration, -S-1 in Technical Services and Extension and ,3C in Resource Assessment De·
velopment. Staft4ng increased by 0,8% over 1986 level9.
Table S. FISHERIES DIVISION STAFF STRUCTURE
tDl
,,
3.1.2 AID PERSONNEL
A total · of (?' US Peace Corps volunteer postings were aUached to the Division during .l98"l.J
mainly to he'rp the Rural Aquaculture Programme.
There were no overseas consultant visits, due to the breakdown in aid-funding,
3.1._3 TRAINING
A total of it1~aff members attended meetings or training courses overseas whilst 9"' staff at-
tended training courses locally.
7

2.2 Page 12

▲back to top
FISHERIES DIVISION
MINISTRY Of PRIMARY INOUSTRIES
HON . VILIAHE GONELEVU
. CHIEF FISHERIES OFFICER
RATU T. CAVUILATI
I
- ~XTENSION
~ - PFO TUILAUCALA
I
RESOURCE ASSESSMENT & DEVELOPHENT
ACT. PFO DR. TIH ADAMS
WESTERN DIVISION
SFO C, EVENING
- LAUTOKA
BA
TAVUA
RAl<IRAKI
SIGATOKA
r l I ACT. SFO M. LAGIBALAVU
INSHORE RESOURCE
~ MANAGEMENT
f.0. K.SWAHY
I
TECHNICAL SERVICES
PFO S.SEWAK
I
ADMINISTRATION
Al (E.O.Pi~
/ z M f irv14-N
- GENERAL SUPPORT SERVICES
f. 0. S.M.SIN6H
- TRAINING
ACT. F.D. t1. TUILOA
NORTHERN DIVISION
SFO A.VUAKACA
- LABASA
SAVUSAVU
TAVEUNI
NABOUWALU
CENTRAL DIVISION
- ACT. SFO L.OAIVALU
NAUSORI
EASTERN DIVISION
- F.O. f. HATE
LEVUKA
KAOAVU
LAKEBA
H GENERAL RA & D I -------··-· .
- MA·RlOAt-ft-lf2.~1.l--JLV~~l?fJ
INFORMATION
['CT. F.O. S.P. SHARHA
AQUACULTURE
,...._ ACT. F.0 . J. VASUCA
- FIJI / JAPAN
AQUACULTURE PROJECT
rl RURAL AQUACUlTURE
I RED TILAPIA
8
- ENGINEERING
F. 0. H. VOSANIBOLA
- REFRIGERATION
FW. Fl. MORREL
- BOATBUILDING. CARPENTRY
ACT. F.O. T. RABULI
- FLEET
F. 0.1. HATEIWAI
--I LOANS I
I
ASSIST. ACCOUNT.
~Jf:5:H•=IWHAR
VitJi0

2.3 Page 13

▲back to top
3.1 ADMINISTRATION
Alherlet 1987
3.1.4 ANANCE
EXPENDITURE
Many planned capital projects had to be shelved pendin2: the resumption of development aid.
The disbursement of funds is detailed below in Table 6. These figures are compiled from our
internal ledgers and still await reconciliation with Ministry headquarters accounts,
Table 6. FISHERIES DIV:ISION EXPENDITURE 1,e1
Total expenditure (excluding Lautoka port) was Sl,557,812.13, a 15% reduction on 1986 expendi·
ture.
REVENUE
Total revenue received for services in 1987 was $617,781.47 a 55% increase over 1986 due
mainly to the sale of vessels. remaining from the previous year, to commercial fishermen.
Table 7. FISHERIES DIVISION REVENUE 19ff'
commerc1a
I ,•
3.1.6 VESSELS
A total of 16 powered vessels were used by the Fisheries Division. Eight of these were based
in Lami, two in Lautoka, two h Taveuni and one each in Laba.sa, Savusa•.,ru, Levuka and Lake·
ha. Twelve of these are smaller vessels constructed by the Division. Of the foUJ larger vessels
(used for fish-collection and resource assessment work), 3 were commandeered by the Auxiliary
U.nit of the Fiji Military Forces. and one (the "Gonedau") underwent elltensive refitting work.
3.1.6 VEHICLES
,J.f The Division utilized a fleet of 19 vehicles. Of these, vehicles were used in the Central Di·
vision, ~ in the Western and in the Northern Division. Several vehicles were commandeered
by the Fiji Military Forces.
9

2.4 Page 14

▲back to top
3.2 TECHNICAL SERVICES
FltharlH 1987
3.1.7 BUILDINGS, Pl.ANTS AND OTHER FACILITIES
The major development in this axea was the sta1t of construction wo1k on Lautoka port improve·
ments under Japanese aid (due for completion in March, 1988) Upgrades of the extension of·
fice facilities at Labasa and Savusavu were largely completed, and a start was made on a new
jetty at Walnlbokasi
3.2 TECHNICAL SERVICES
3.2.1 BOAT BUILDING PROGRAMME
A total of 18 9·metre vessels were constructed in 1987, bringing the total number of such ves·
sels constructed to 272. 12 were sold to rural trainees, whilst 4 were sold to commercial fish·
ermen. In addition, 6 7-metre vessels and 12 9-metre punts were constructed for the rural de·
velopment programme. The boatbuildlng programme was held up towards the end of 1987 due
to ucalating costs and the unavailability of the engines normally supplied under Japanese ald. It
is hoped to resume both boatbuilding and rural training courses by mid· 1988.
Meanwhile work is prouessing on the maintenance of existing boats and on a follow-up pro·
ii:ramme to determine the effectiveness of the FDB·assisted rural-training proii:ramme.
3.2.2 FIJI DEVELOPMENT BMK LOAN ASSESSMENT
A total of 238 loan applications were processed by Divisional Officers, and 181 applications
(amounting in value to $342,319) were approved in 1987. This was a 1% increase in number
and 26% decrease tn value over 1986 Joans approved.
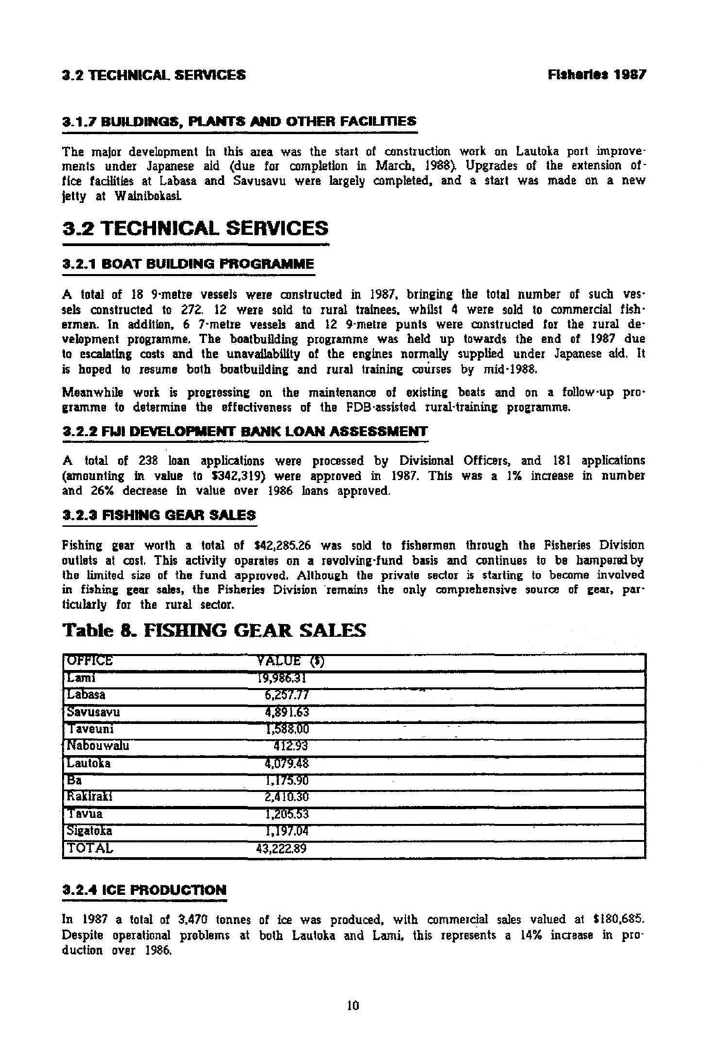
3.2.a FISHING GEAR SALES
Fishing iear worth a total of $42,285.26 was sold to fishermen throu2h the Fisheries Division
outlets at cast. This activity operates on a revolvini·fund basis and continues to be hampere:i by
the limited size of the fund approved. Altbouii:h the private sector is starting to become involved
in fishin&: cam sales, the fisheries Division ·remains the only comprehensive source of gear, par·
ticularly for the rural sector.
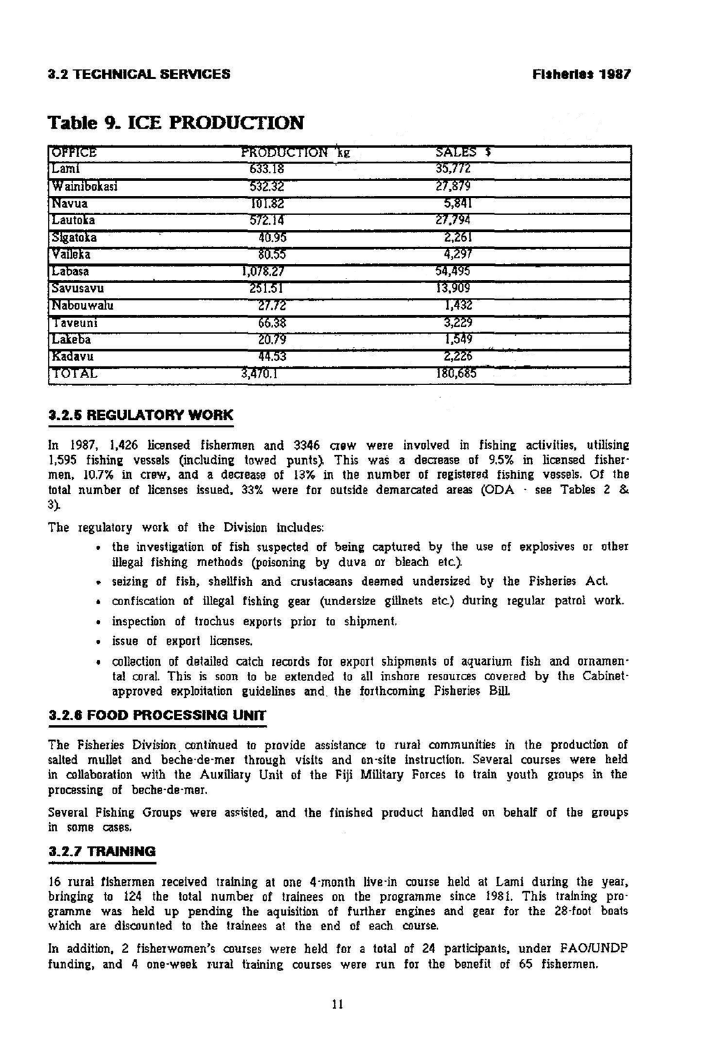
3.2.4 ICE PRODUCTION
In 1987 a total of 3.470 tonnes of ice was produced, with commer~ sales valued at $180,685.
Despite operational problems at both Lautoka and Lami, this represents a 14% inaease in pro·
duction over 1986.
10

2.5 Page 15

▲back to top
3.2 TECHNICAL SERVICES
Table 9. ICE PRODUCTION
g
Fltherlet 1987
3.2.5 REGULATORY WORK
In 1987, 1,426 licensed fishermen and 3346 crew were involved in fishin2: activities, utilisinE
1,595 fishin2: vessels (including towed punts} This was a decrease of 9.5% in licensed fisher·
men, 10.7% in crew, and a decrease of 13% in the number of registered fishing vessels. Of the
total number of licenses issued, 33% were for outside demarcated areas (ODA · see Tables 2 &
3).
The 1egulatory work of the Division includes:
• the investigation of fish suspected of being captured by the use of explosives or other
illegal fishing methods (poisoning by duva or bleach etc.).
• seizing of fish, shellfish and crustaceans deeme_d undersized by the Fisheries Act.
• confiscation of illegal fishing gear (undersize gillnets etc) during regular patrol work.
• inspection of trochus exports prior to shipment.
• issue of export licenses.
• collection of detailed catch records for export shipments of aquarium fish and ornamen·
an tal coral This is soon to be extended to inshore resources covered by the Cabinet·
approved exploitation guidelines and. the forthcoming Fisheries Bill
3.2.8 FOOD PROCESSING UNIT
The Fisheries Division_ continued to provide assistance to rural communities in the production of
salted mullet and beche·de·mer through visits and on ·site instruction. Several courses were held
in collaboration with the Auxiliary Unit of the Fiji Military Forces to train youth groups in the
processing of beche·de·mer.
Several Fishing Groups were assisted, and the finished product handled on behalf of the groups
in some cases.
3.2.7 TRAINING
16 rnral fishermen received training at one 4·month live·in cou1se held at Lami during the year,
bringing to 124 the total number of trainees on the programme since 1981. This training pro·
gramme was held up pending the aquisition of further engines and gear for the 28-foot boats
which are discounted to the trainees at the end of each course.
In addition, 2 fisherwomen's courses were held for a total of 24 participants, under FAO/UNDP
funding, and 4 one-week rural training courses were run for the benefit of 65 fishermen.
11

2.6 Page 16

▲back to top
3.3 EXTENSION SERVICES
AsherlH 1987
3.3 EXTENSION SERVICES
The Extension Section continued to provide the link between the Fisheries Division and the fish·
ermen.
As well as their role in mediation, and the transfer of technology to fishermen, the 40 staff
(spread over 14 stations) were fully involved in .licensing and regulatory activities, ice and gear
sales, loan processing, fish processing, advisory services and lectures, and practical demonstrations
to school and fishing groups.
3.4 RESOURCE ASSESSMENT AND DEVELOPMENT
3.4.1 COLLECTION OF PRODUCTION DATA
Municipal markets were surveyed at least six days per month (always including the highest vol·
ume day of the week) and the sampling was applied to manet·masters records to obtain a com·
plete summary. Roadside outlets were coveJed in depth at least once a month, and all other
outlets quarterly. A system of confidential logbooks for the recording of purchases by these out·
lets was instituted, which should 11:reatly improve the accuracy of data obtained.
The purchases/sales by species, weight and, if possible, price form the p1oduction estimates for
the artisanal sector, and are detailed in the Appendices.
3.4.2 BAITRSH AND TUNA CATCH STATISTICS
Catch statistics, supplied on stan".iard forms by lka pole and line and other industrial vessels,
are analyzed monthly and cross·referenced to PAFCO landings. Information summades are set to
SPC for inclusion in the regional tuna stock ·assessment programme.
3.4.3 ASHERY RESOURCE MANAGEMENT
In addition to the above. detailed catch/production data were obtained on aquarium fish, ornamen·
tal coral and deepwater snapper, and the harvest of sedentary resources vulnerable to over·ex·
ploitation (e.g. giant clam, black coral, trochus, beche·de·mer) is monitored. Resource profiles and
a fish commodity profile have been prnduced to assist planners and investors. and these will be
updated in 1988. Draught legislation has been prepared, but awaits finalisation.
3.4.4 COASTAL ZONE MANAGEMENT
Fisheries assessments of proposed foreshore rnclamations are routinely carried out. 9 applications
(totalling 40ha) were recieved in 1987, and su1v!!ys performed, but only two cases were heard
by the arbitrator during the y~ar.
6 cases of 'fish·kill' were ri:portod du1ing the yea1. 3 in the Northern Division and 3 in the
Central Divir,ion. All of thesl3 kills oce1.me.d after b~avy rain broke Ion!! dtought spells. Water
and fish analys&s shuwed insigr1tricant traces of suspr:cted chemicals, and the cause of tlw kills
was not positively identified.
- - - - - - - - 3.4.6 FAD DEPL.OYMENT
Six Fish Aggregating Devices w&re deployed during 1987. This low llUmber was caused by the
unavailability of essential parts from New Zealand for a period and, later, the unavailability of
the Fisheries Division resea1ch ve~sel for deployments. Thanks are due to the Institute of Marine
Resources, USP, for helpine: with deployments around the Suva area.
In future, FAD deployments will be split into two categories:
• Offshore FADs for use by Industrial Tuna vessels, A levy on Tuna catches will be
used to finance this, and IKA Corporation will help with deployments.
12

2.7 Page 17

▲back to top
3.4 RESOURCE ASSESSMENT AND DEVELOPMENT
Rtherlet 1987
• Nearshore PADs for rural development and artisanal fishing. These will be financed
and deployed entirely by the Fisheries Division.
An SPC training course was attended, and many improvements have been made to the design
for the 1988 season. This should improve the life-expectancy of the devices deployed.
3.4.8 DEEPWATER SNAPPER
The semi-industrial fishery for deepwater snapper e:athered momentum in 1987, and the Fish·
eries Division concentrated more on stock assessment than on fishery development as in the past.
A management plan for the resource was formulated, and this will be revised, if necessary, as
assessment work progresses.
3.4.7 GIANT CLAM PROJECT
The Project officially ended in June, but interim funding was obtained to keep the project tick·
ine: over until the start of Phase II in 1988. Extensive resource surveys showed that flklr1m,1
den'l.f"tT (vasua dina) is e:rossly overfished, and that action must be taken soon if natural stocks
are to stand any chance of recovery.
The new qua1antine/mariculture facility on Makogai imported some juvenile T.rf&,1s with the event·
ual aim of re-introducing this species to Fiji waters. Mariculture 1rials on local species will begin
in 1988,
3.4.8 SEAWEED CULTURE
Development work involving 240 farms (a 50o/o increase on 1986), in various stages, continued
with aid support from New Zealand, and a major new growing area was established in Bua.
277 tonnes of weed were eKported, a 60% inCiease on 1986 but still short of projected targets.
Fearing the consequences of trade-bans, many farmers diverted effort into the collection of other
fishery resou1ces. Production recovered in the last few months of 1987, and the Fisheries Divi·
sion will be concentrating on !he development of the Eastern Division.
3.4.9 FRESHWATER ASHERIES
Work in this area slowed down somewhat wilh the departure of our Peace Corps freshwater
biologist. Continued monitoring of the impoundments stocked with fish in previous years (Vatu·
ru and Monasavu) showed very promising grow1h, pa1ticularly of the Bass. Reports were pre·
pared on the biolo2y of several species, and their status in Fiji, and a protocol was developed
for investigating fish·kills.
AQUACULTURE
3.-4.10 MACROBRACHIUM CULTURE
Hatchery production of I million post-larvae per year, with yields of up to 1.2 tonnes/ha/yr, has
been achieved at the Naduruloulou hatchery. Growout trials are continuing, and a start was made
on prawn/fish polyculture trials, with very promising results.
3.4.11 PRODUCTION OF MAJOR CARPS
Induced spawning of 3 carp species has been achieved, and the river weed control programme,
using grass carp, continues to be a great success. Attention is now moving to Western Division
rivers, although the weed p1oblem here involves water-hyacinth and may be a little more diffi·
cuII to control.
13

2.8 Page 18

▲back to top
3.5 INFORMATION AND LIBRARY SERVICES
A1herle1 1187
3.4.12 RED Tll.APIA CULTURE
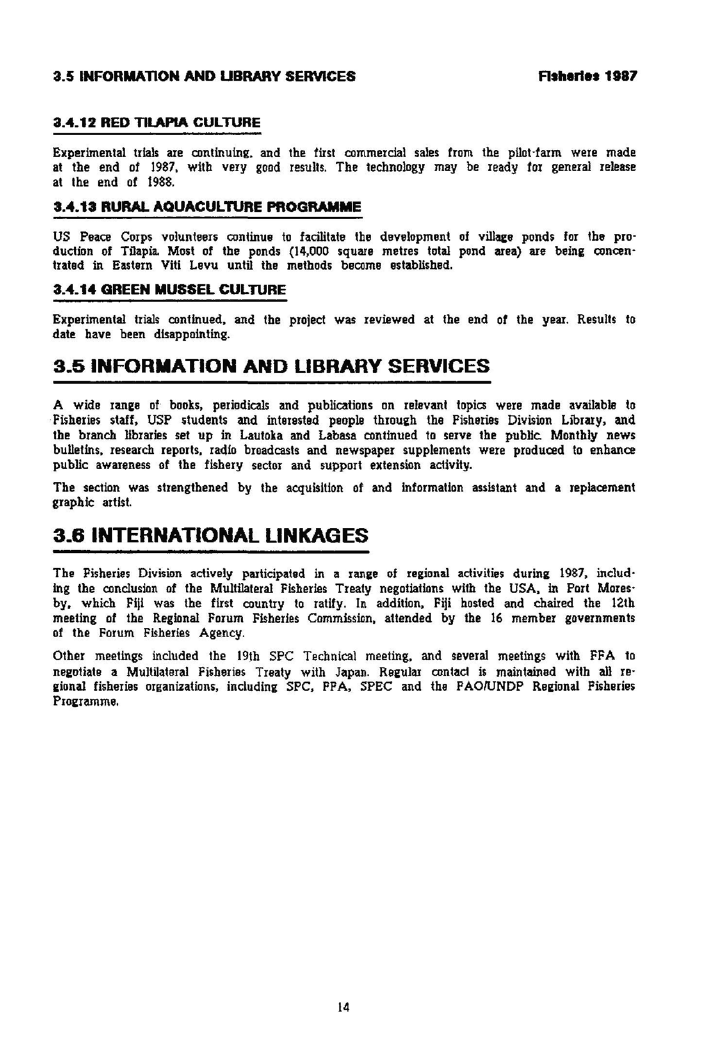
Experimental trials are continuing. and the first commercial sales from the pilot·farm were made
at the end of 1987, with very good results. The technology may be ready for general release
at the end of 1988.
3.4.13 RURAL AQUACULTURE PROGRAMME
US Peace Corps volunteers continue to facilitate the development of villace ponds f(Jr the pro·
duclion of Tilapia. Most of the ponds (14,000 square metres total pond area) are being concen·
trated in Eastern Viti Levu until the methods become established,
3.4.14 GREEN MUSSEL CULTURE
Experimental trials continued, and the project was reviewed at the end of the year. Results to
date have been disappointing.
3 ..5 INFORMATION AND LIBRARY SERVICES
A wide 1ane;e of boob, periodicals and publications on relevant topics were made available to
·Fisheries staff, USP students and intemted people thrnu2h the Fisheries Division Library, and
the branch libraries set up in Lautoka and Labasa continued to serve the public. Monthly news
bulletins, research reports, ra<lio broadcasts and newspaper supplements were produced to enhance
public awareness of the fishery sector and support extension activity.
The section was strengthened by the acquisition of and information assistant and a replacement
graphic attlst.
3.8 INTERNATIONAL LINKAGES
The Fisheries Division actively participated in a range of regional activities during 1987, includ·
ing the conclusion of the Multilateral Fisheries Treaty negotiations wi1h the USA. in Port Mores·
by. which Fiji was the first country to ratify. In addition, Fiji hosted and chaired the 12th
meeting of the Regional Forum Fisheries Commission, attended by the 16 member governments
of the Forum Fisheries Agency.
Other meetings included the 19Jh SPC Technical meeting, and several meetings with FFA to
negotiate a Multilateral Fisheries Treaty with Japan. Regular contaci is maintained with all re·
2ional fisheries organizations, including SPC, PFA, SPEC and the PAOIUNDP Re1idonal Fisheries
Programme,
14

2.9 Page 19

▲back to top
AP P E NDI X
F I GURE S
15

2.10 Page 20

▲back to top
1.B0[1
1600
1400
1200
1000
WT(MT)
VOLUME OF FISH SALES AT UARIOUS MARKET
OUTLETS IN 1986 AND 1987
600
400
200
0
Ml,;;t
Ss:h
Rd
FISH MARKET OUTLETS
+-----~~
f ) u.x
Hkt - Hunicipal ttarkets, Htl - Hotels &Rest., But - Butchers, Ssh - Supermarkets &Shops, Rd - Roadside,
NHA - National Narketing Authority, Aux - Au~illary Unit
16

3 Pages 21-30

▲back to top

3.1 Page 21

▲back to top
AP PENDI X
TABLES
11

3.2 Page 22

▲back to top
UNLOADING GUANTITY BY BOATS IN 1987
TABLE 1
\\ NONTH
BOATS \\
JAN FEB NAR APR KAY JUN JUL AU6 SEP OCT NOY DEC Total
:==========================================================================================================~======================
I
I
1)Long line
J'
l SHIN KINS YANS ND 3
0
(j 76.622
0
0
0 70.201
0 91.95 . 0
0
0 230.773
I JIN DINS
0 96.95
0
0
0
0 125.137
0
0
0 109.886
0 331.973
l DER CHAN6
0
0
0
0
0
0 52,339
0 67,079 17.904
0
0 137.402
I SHENG YUH NO 6
0 41.907
0
0
0
0 95,442
00
0 97.94
0 235.289
l SHENG MANS NO 7
0
0
0
0
0
0
0 112.151
0
0 101.808
0 213.959
l HAI SHIN
0
0
0
0
0
0
0 115.394
0
0 95,285
0 210,679
l HAI CHAN6 NO 1
0
0
0
0
0
0
0 104,53
0
0 83.973
0 188.503
l HUAR CHENG NO 1
0
0
0
00
0
O 10S.91e
0
0
0
0 108.918
l HORNS SHINS
0
0
0
0
0
0
0 24.29b
0
0
0
0 24.296
: LIH FAH
0
0
0
00
0
0
O106.373 B.99
0 91.54B 206.911
I SHIN CHYUN NO 7
0
0
0
0
0
0
0 .0
0
0 100,994
0 100,994
LONG DAR NO 21
0
0
0
00
0
0
0
0
0 130,186
0 130.186
I LIH SHENG
41.051
0
000
0
0
0
0
0
(I
0 41.051
JIE YEOU NO 6
0
0
0
0
0
0
0
0
0
0
0 69.442 69.442
I SHENG JYI NO 7
0
0
(I
00
0
0
0
(I
0
(I 123,06 123.0b
I ------------------------~---------------------------------------------------------·------------------•w-------------------------
SUB TOTAL
41.051 139.857 76.622
0
0 · 0 343,119 465.299 265.402 26,976 720.072 284,05 2361.436
---------------•==----~-. ====-------====------=====•---=======--M=======•--=-======----•-=---=----------------------------------
2) Pale & _line
0
0
H l'IARU NO 7
142,254 89,766 150,539 91.515 113.71 63.407
0
(I 41.806
0 39,194 111.53 843.521
H HARLI NO 8
177.327 97,804 · 141,16 98.947 142.96 61.471
0
0 33.826
0 43,91 145.33 942.735'
I IKA NO 5
92.503 84.197 107.986 B6,892 114,492 71,859 26,134 2,51
0
0
0 59.106 645.679
IKA NO 7
IKA tm 8
66,B25 76,383 105.04 32.27 58.827 29.003 40,677 16.06 35.493 16.454 15,058 44.28 536,37
87.299 83.188 106.395 48,192 13.072
0
0
0 0.015 1.582 39,276 51.184 438.203
: INDEPENDENCE
64.204 79.,32 123,699 62,199 37.C/9 47,04 39.084 2.(198
(1
0
Q
(I 455.634
: ----------------~---------~-~---------~M-----------------------------•-----------~-----------------------•----------------------
SUB TOTAL
630.412 510.658 734,619 420,015 481.051 272.78 105.895 20.668 119.14 18.036 137,438 411. 43 3862.142
: ------=--------===---•---====------=====~- ·----====--~----====-"A--=====~-----=:===----------=-----------------------~~---------
POLE AND LINE F.VESSEL
NEl ARJNTETOSO
NE I KANEATI
0
0
0
0
0
0
0
0
0
0
0 11.604 11.604
0
0
0
0
0
0
0
0
(I
0
0 11,629 11.629
SUB TOTAL
0
0
0
0
0
0 .0
0
0
0 23.233 23.233
======~=========~==========================================;=========~===========~;=======================-:========------------
''
!HPORT
PN6 (IMPORT)
0
0
0
0
0
0
0
0 . 0 378. 922
0
0 378.922
l KIRIBATI !
0 77.588
0
0 0 337.52
o- 105.375
0
0 40,888
0 561.371
I SOLOHON
0
0 341,165
0
0 1483.05
0
0 369,117
0
0
0 2193.333
iAHITI
0
0
0
0 344.568 50.327
0
0
iJ
0
0
0 394,895
NEW ZEALAUD
0
0
0 90.683 14.724
0
(j
0
0
0
(I
0 105.4(17
: JAPAN
0
0
0
0
0
0
0 0 0 1198. 71
0
0 1198.715
: ----~---------------------------------------------------------------------------------------------------~------------"---~~~~-~-
: SUB TOTAL
0 77.588 341.165 90,683 359.292 1870.89
0 105,375 369,117 1577.63 40.888
0 4832,643
==:============~========;=========;======================;================================ ·=========================-~~---------
GRAND TOTAL
671,463 727,103 1152.40 510,698 840,343 2143,67 449.014 591.332 753.659 1622.64 898,398 718.713 11079,4S4
===::~=-----=~~===~=~~~=======~==============================~~=====================:==========~===~~~===----------------------~
18

3.3 Page 23

▲back to top
UNLOADING QUANTITY OF rISH BY SPECIES AT PAFCD:
TABLE 2
YEAR: 1987
\\ HDIHH
SPECIES \\
JAN
FEB
HAR
APR
HAY
JUN
JUL
AU6
SEP
OCT
NOV
DEC TOTAL
----------------------------------------============================-=-=-==--------================-----------------------------------
1)Long line
ALBACORE
YELLOWFIN
BI6EYED TUNA
BLUE HARLIN
BLACK HARLIN
SWORD FISH
STRIPED HARLIN
SAIL FISH
SPEAR FISH
WAHOO
HAHI HAHI
BLUE SHARK
SKI PJACK
OTHERS
40.239 135.898
0,000 0.000
0.000 0.000
0,000 0.000
0.000 0.000
0.000 0.000
0.000 0.000
0.000 0.000
0.000 · 0.000
0.000 · 0.000
0.000 0.000
0,000 0.000
0.812 2.9~9
(1,000 0.000
bLQ30
14,576
0.000
0,000
0.000
0.000
0.000
0.000
0.000
0.000
0.000
0.000
1.01b
0.000
0.000
0.000
0.000
0.000
0.000
0.000
0,000
0,000
0.000
0.000
0.000
0.000
0.000
0.000
0.000
0.000
0.000
0.000
0.000
0.000
0.000
0.000
0.000
0.000
0.000
0.000
0.000
0.000
0,(100 340.388 465.289 208.6b4
0.000 0.000 0.000 51.656
0.000 0.000 0.000 0.000
0.000 0.000 0.000 0.000
0.000 0.000 0.000 . 0.000
(>,000 0.000 0.000 0.000
0.000 0.000 0.000 0.000
0.000 0.00(1 0.000 0,0(•0
0.000 0.000 0.000 0.000
(1,000 0.00(1 0.000 0.000
0.000 0.000 0.000 0.000
0.000 0.000 0.000 0.000
0.000 2,73.1 0.000 5.082
0.000 0.000 0.000 0.000
0.000 718.086 283.324
25.521 0.000 0.000
0.000 0.000 0.000
0.000 0.000 (1.0(10
(1,000 0.000 0..(10(1
0.000 0.000 0.000
0.000 O.OM 0.000
0.000 0,000 (!,000
0. (10(1 0.000 0.000
0. 001) 0.000 (1,000
0.000 0.000 0.000
0.000 0.000 0.000
1.455 1,986 0.726
0.000 0.000 0.000
2252.918
91,753
0.000
0.000
0. 000
0 .000
0.000
o. !)00
0.000
0.0(10
(1.000
(I, 0(H)
16.767
0.000
Sub Total 41.051 138.857 7b.b22 0.000 0.000 0.(1(10 343.119 4b5.289 265.402 26.976 720.072 284,050 236L43B
----=;=~==-==========================================================:===================================================---~--=====:=
2)Po1 e -~ Line
/ll&:ACORE
0. 000 0.000 0.000 . 0.000 0.(10(1 0.000 0.000 0.000 0.000 (>.000 0.000 0.000
0.000
YELLOWFIN
83.797 35.341 56.2H 44.709 Sb.297 44.5b4 40.530 4.174 2.797 3.1% 22.808 16,227 410.65.3
BISEYED TUNA 0.296 0.000 0.000 0.000 0.012 0.000 0.140 0.000 0.000 0.708 0.038 0.000
1.194
SKIP JACK
546.319 475.317 678.406 ·375.306 424. 746 228,247 140.857 lb,506 40. 7il 14,1-32 114.592 418.443 3473.582
OTHERS
0.000 0.000 0.000 0.000 0.012 0,000 0.140 0.000 0.000 0,000 0.038 0.000
0,190
Sub Total 630. 412 510.658 734.619 420.015 481.067 272.811 181.667 20.680 43,508 18.03b 137,476 434.670 388S.619
================~=================:============~================================:=========================:==~=======-=--------=======
3) IMPORT
ALBACORE
0,000 0.0% 0.000 90,295 359.114 50.327 0.000 0.000 0.000 (i,(!(ii) 0.000 {J,(l(l(l 49~.736
SKIP JACK
0.000 26. 776 338.262 0.228 0.036 1475.945 0.000 81.567 328,388 1459.245 lb.416 0,(IQO 372b.863
YEi.LOWFIH
BlG EYE
(l,O(i(I 48.738 2.903 0.160 0.142 333,104 0.000 21.764 4(>, 690 96.206 23.732 0.000
0.000 2.074 0.000 0.000 o.oo~· U.522 0.000 2,044 0.039 7.360 0.740 0,0(10
567.439
23.799
GTHERS
0.000 0.000 0,000 0.000 0.000 0. (f{!O 0.000 0.000 0.000 14.81)6 0.000 0.000 14.806
Sub Total
(l, 00,0 77. 588 341. 165 90,b83 359.292 187(),898 0.00(> 10~. 375 369.117 1577.637 40,888 0.000 4832.643
~--------=---=--=--===;==----=-=-------=================================:============~==============-=====----------------------------
BR!Hil:! TOTAL 671.463 727 .1(13 1152. 406 51(1,098 840.359 2143.709 524. 78b 591.344 b78.027 1b22.649 898,flb 718. 720 110H, 7(H}
-----------------------------------------------------=---=----------------·-----------------=------------------------------------------
19

3.4 Page 24

▲back to top
TABLE 3
FOOD FISHES OF FIJI BY FAHILY ml! CONNON FIJIAN NANES
===-==---==--=======.:==================================
Fij ian naes Scientifie na1es
Fijian na1es Sdentific na1es
Fii ian naies Scientitic na1es
Fijian naaes Sci enti tic naes
=======.::.=== -================
============ ======-==========
============ ===========:z:::
======•==== ===============
LETHRJNIDAE
LUTJAIIJDAE
NULLIDAE
LABREDAE
===========
Kairago
L. nebulosus
==========
Lilidau
Sy1phorus neattophorus
::::.:::::
Ki
=====:==
Upeneus vittatus,U.sulphureus Variroce
Cheilinus undul atus
Kacik a
L. nnthochih
Da•u
L. argentiaculatus
Hataroko P,indicus
Sabutu
Kaba tia
L. uhsena
Bati
L. reticulatus, L. rubriopercul atus Kake
L.bohar
L,quinquelineatus,L. tulvus TRICHIURIDAE
DASYADIDAE
--------
L, variegatus ,L. se1icindus
L.fulvifli•• a
=====
Yaidina
A, kuhlii
Nau
6ynocranius spp.
Bo
L.gibbus
Tcvisi
T, hau1ela
Dokonivudi L.elongatus
Utouto
Aprion vi rescens
CARCHARH IN IDAE
Sabut11da1u L.~allopt!!rus
Sewidri
Aphareus rutilans
LEIOGNATKIDAE
:::::z::::::::
Sabutukula N,1ossa1bicus
Uluqa
Paracaesio Kusakarii
========-===
Qic
Carch1rhinus spp., TriilHDdon,
Rcsinibogi l, tiorensis,L,ulabaricus Kaikai
L.equulus,L. fasciat11s,6,1inuta
llegaprion
.S,E_R_M_N_I_D_AE...
Opahpaka
Regua
Pristipo1oides spp,
L, rivulatus
&ERREIDAE
CICHLlDAE
========~
Kawakawa
Epinephelus spp.
::==::=::
llaleya
T,cssabica
Kasala
E,icrodon
Kasaledau C, iniatus
_S.C,.A_R_I_D_A_E
Natu
Serres spp ,
SENPLJDAE
Senih11aka11a E,1erra
Ulavi
Scarus spp.
HAENULIDAE
=====-===;.
Donu
Plectropous spp.
Katia
Bolbo1etopon 1uricatus =========
Na lake
P. prcetheus
Delabulewa E. fuscoguttatus
Sevaseva Plectorhynchus spp.
Kav u
P.lanceclatus
N
0
SCONBRIDAE
BELDNIDAE
-----------
Saku
Tylosurus spp,
TERAPDtllDAE
==--=====
IIURAENESDCIDAE
=========-=====
Ikasa
11,cinereus
===:::::;:::=.==
Oita11i1
T jarbua
S;ihla
Rastrel-liger spp,
Votoni1oli Scoberoides spp,
HEIIIRHANPHIDAE
====:=========
Reve
11,kneri
P-L-ll-TA-C-[-O-A-E
Walu
Sco1ber01Drus c011ersa1
Busa
Heirhaaphus spp,
Salalaniloga /legal aspis, 6raaatcrcynus
CHANIDAE
-...-..-..-..-...-...---..-------
Yunavuna
Platu spp.
DogtoDth
Skipjack
gyanosarda unicolcr
Katus1mnus pelais
POLYNEl!IIIAE
=~:======'::=
Yawa
Chanos chanos
DSTRACIDAE
--------
Yellowfin Thunnus albacares
Uculuka
P, plebeiusl ,1icrosto1us CHIROCENTRIDAE
Toa
0. tuberculatus
llackeral Tuna Euthynnus affinis
Kela
L.lactarius
============:
Yoivoi
C,dorab
HDLOCENTRU)AE
CARAN&IDAE
----------
ELOPIDAE
--------
CDRYPHAENIDAE
======:=====
Corocoro
Nyripristis spp,
Saqa
Caranx spp,
Yavuli
N, cyprinoides
==========-==
Saqaloa
Caranx lugubris
Kahiahi C,hippurus
KUHLIIDAE
Yatule
Selar cruenophthahus
Ra in bow Runner E, bi pinnula tus
IIU&ILJDAE
--------
Koto
11.cephalus
--SC-A--TD--P-H-S-ID-A-E-
========
llataba
Ikad roka
K,bilunulata
K,rupestris
ACAHTHURIDAE
hva
L,vaighnsis
Batehu
S,argus
=============
Kanace
Y, seheli, Y, buchanani
DIOIIONTIDAE
Tabate
~. lriostegus
Nolisa
L.111inoptera
KYPHUSIDAE
=====-=====
Balagi
A.xanthnpterus
========::.=
Sokisoki
D,hystrix
lo
K. unicornis
SPHYRAENIDAE
Sirisiriirai Kyphosus spp,
============
EN6RAULIDAE
SISANIDAE
Oqo
Sphyraena spp.
TETRADONTIDAE
===========
---------
=====:::::::::::
Vaya
T,baelaa
Nuqa
S. spinus,S. ~er1iculatu~
CLUPIDAE
Su1usu1u Arothron stelbtus
S,chrysospi los, S.do! iatus
-------
Vesa(Soked fish i
Dan1va
H, quaOriacu Iatus

3.5 Page 25

▲back to top
TABLE 3 CONT....
NOH FISH SEAFOOD OF FIJI WI TH C0!1MOH FlJIAN NAMES
F__i_ji..a._n___n_a_t_es_
------------
PRAWN
iioci
Ura
CRAB
Oari
Kukadau
Ugavule
Kukaloa
Oarivatu
~airo
Uarudiria
Hana
BIVALVES
----------------
Kaikoso
kaidamu
Oaqa
Sigawale
Vasuadina
KAtavatu
Cega
Civa
Kuku
Kaiif/w)
TURTLE
Taku
Vonudina
Scientific names
================
P. concinnus
P.canaliculatus,P,monodon,
H.equidens, H.rosenbergii,H,lar
S. para1a11osain
S. erythrodactyla
Birgus latro
Ii. 11essor
T. crenata
C. carni fex
P. versicolor, P. ornatus,
P. penici llatus
T, ano1ala
A. cornea
Periglypta puerpera
6afrariu1 tu1idu1
Atactodea striata
T. derasa
T. 1axi111a
T. squamos~
Pinctada Aagaritifera
Hodiolus agripetus
Batissa violacea
Fijian names
------------------------
6ASTRAPODS
==========
Yaga
Sici
Tovu
Hadrali
6olea
Drevula
ECHINODERKS
----------------------
Daire
loaloa
Yula
Cawaki
Sucu11alu
--SE--A--W----E--E--D--S
Na1a
lu1i11a11a
MISC.
Tadruku
Veata
Kuita
Eret1ochelys imbricata
Chelonia aydas
Scientific naftes
----------------
Lal!lbis lambis
Trochus niioticus
Trochus pyramis
Nerita polita
Stro1bus gibberulus
Polinices fle1ingiana
Hetriatyla scabra
Hicrothele nobillis
Bohadschia armorata
Tripneustes gratilla
Klrothele fuscogilva
Caulerpa racemosa, Caulerpa sp.
6racilaria verrucosa
Acanthozostera ge11ata
Dolabella auricularia
Octopus sp.

3.6 Page 26

▲back to top
KUNICIPAl MRr.H TISH PRICE 1907
TABLE 4
Prict
111:s
SFECIES
NAY NAU Him SIN lAD KOR SIG HAD NA" llK PA TAY RAK LAB SAY
"un ""• "••n Kun
K,an Kun
Nun Run ll,an Kuo Kun Kun "',n Kuo
"··· Prlc• Pritt Pritt Price Pric• Pric• Pric• Prlet Ptlct Price Prln Prln Prln Pric~ Prin
1.95 2.33 2.55 2.86 2.60 2.07 2.69 2.42 2.62 2.42 2.H 2.11 2.42 1.69 1,81
Kun
2.33
z.~, ========:::::::::::::::::::::::::::::::::::::::::::::::::===,;,;::::::::::::::::=:::r:::::::::::;::::r:s::::::::::i::::::::::::::::::::::::::::::::::::::::::::::::::::~::;:z:::::::::::::::;::;:::::::::::
Y.oago
2.61 3.15 3.15 3,30 3.10
3.20 3,24 3.35 l.18 3,21 2.88 3.21 2,67 1,99 2,99
racib
3.08 2.14 3.04 3.30 3,11
2.88 3.00 2,76 2,87 2.57 2.1, 2.28 1,99 2.BO
Sabulu
MT 2,62 2.89 3.16 2.5B 2.,0
2.78 2.95 2.77 2.B5 2.63 2.91 MT 2.00 2.74
rn1ti•
na•i
Bu
2.24 2.41 2.75 2.70 2.40 2.1& 2.98 2.48 2.50 2.49 2.41 2.23 2.35 1,U 1,50 2.35
'·" 2.73 2.24 2.5& 2.BO 2.30
2.40
2.57
2.77
uo 2.30 1.,0
1.90
2.43
2.15
O~tonlvudi
2.09 2.12 2.78 2.78 2.20
2.84 2,86 2.66 2,74 2.59 2,7& 2.33 l.'8 2,52
S1futuduu
3.00
J.00
i,97 2.00 2,49
Sabutuhh
k1W1h•1
2.59 3.33 3.22 3,16 3.21 Ml 2,BO 2.98 3.10 2.97 U& 2.6& 2,80 2.33 2,06 2.BS
Y.aru
2.00
2.79 2.75 2.50 2.59 2.50 1.40 1,92
2.31
Kn1h
uo 5Hihw1h•1 2.12 2.36 3.00 2,73 2.10
2.92
2.80 3.00 Ml 2.30 2,20
2.&3 2.60 M6 Ul 2,50 MO
2.&2
2.50
DDMI
hlabuho
2.10 2,70 2.51 2,72 2.78
2.10
2.98 3.08 3,30 3.04 3.07 2,78 2.7& !.92 1.71 2,68
us 2,35
1.87
2,19
S1l1h
N1lu
1.90 2.04 2.3f 2,70 2.16 I.SS
2.65 2,67 uo 3.55 3.37
2.63 2.60 2.62 M9 2,07 2.05 1.50 1.30 2.17
2.92 3.00 2,94 U5 2,97 2.91 2.'1 2,22 2.90
~ahoo
Sal1hnit1191 2.00 2.30 1,68
2.29
»01tooth
StipJ,cl
1.67 3.00 i.eo 2,30
Y•I lowlin
1.60
1.68
Kathnl Tuoa
2,07 1.75 2.05 1.91 1.54 l.90 1.37
1.H
2.30
I.fl
2.12
l.92 1.70 1.91 1.85
l.55 1.54 l.92
2.10 2.00 2,17 2.01 2.01 1.00 1.55 1.90 1.91
S1q1
2,24 2.37 2,76 2.e2 2,34 2,lO
2,41 2.40 2.12 2.37 2,29 2.52 l,98 1.92 2.36
Saqalo•
2.00
MO
1,38
2.09
hlulP
I.SO
l ,M 2.10
1.90
1.40
1,6B
Koli
2.00
2.QO
Yolonioli 1.53 2.04 I.Bl, MO 1.69 I 14
I.U 1,65 J.71 1.66 1.63 1.60 0.91
l,72
R•i•b~~ Runn!r
2.15
2,50 1.80
2.00 1,60
1.26
1.91
Ki
2.06 2.20 2:6' 2,72 2.21 l.OB 3.10 2.04 2.00 2.01 2.03 1.71 1.83 l.o 1.19 2,08
Kalaroh
MO 2,37 MT 2.67 ?.JI 1.58
2.15
2,13 2,12 2.00
1.43 2,44 2.16
laiduc,
2.63 2.65 2.76 2.47 2.50
2,6' 2.76 U9 2.Sl 2.59 2,13 l.80 2,10 2.51
&a111
2.19 2.37 1.43 2.&2 2.29 l,'7 3.00 2.51 2.'2 2.52 2.52 2,28 2.50 1.55
2.39
Bati
2,15 2,27 2.31 2.06 2.09
2,23 2.10
1.28
2.07
Kai•
1.9$ 2,23 MT 2.60 2.2, 2.31 2.98 2.18 2.28 2.23 2.35 1.97 2,37 1.s2 1.98 2.21
R!jUI
Po
2.07 2.00 2.30
2.43 2.67 UT 2.56 2.s,
2.10
2,12
2.59 2.90 2,73 2.63 2.60 2.S4 2.09 1.49 2.48
Ubuto
S!•idrl
Ulu1a
Ro1inibogi
or111pa~•
B•Oford
hbac,
hlagi
la
Uhvi
hlia
2.50 2.30
2.62 2.&5 2.s, 2.58
2.80 1.98
2.SO
2.19
2.19
3.40
3.02 3.20 2.9-9 J.05 2.86 2,88
3.06
MS
MO
l.21 uo 2,79
2.11 2.10 2,25
2.90
J.00 2,75 2.SS
2.18 2.00 2.65
J.00
2.SO
2.10
2,60
2.55
J.05
l.50 1.50
1.80
1.98
l,S4
1.56
1.12 2.30 2,S3 2.2B 2,33
2,30 U1 2.00 2.16 2.95 2.20 1,98 1.31 1.13 2.09
I.BB 2.60 2.17 2.50 2.39 2 10
1,93 1.80 J.93 1.91 I.Bl 1,81 1.25 1.06 2.01
1.86 2.38 2.16 2,79 2.28 2.10 2.50 1.87 1.10 ,.e, l ,'7 J,4S 1.e2 l.22 1,39 2,1'
2.11 2.e, 2. ZS 2.25
1.30 1,89 1.98 2.10
Ktrk•rtcuh
2.80 2. 13
2.28
Z.23 2.01 2.03 2.18
2.21
Vculuh
Xoto
l.wa
1.86 2.16 2.29 2.68 2.27 2.08
2.00
2.16 2,90
2.2~ 2.00 2.68
2.12
..,, 2,10 1.90 2. 09 1.91 2.00
I.If
1.25
1.90
2.00 2.55 2.U 2,45 MO 2.S0
2.04
1.92
2.21
Kanatt
1,98 2.06 2,45 2.67 2.39 2.11 2.so 2.66 2.78 2.61 2.56 2,34 2,34 1.89 1,93 2.35
Koliu
1.30 2.40 2.40 2.20
2.08
Dil1•1
1.70 2.05· 2.23
2,19 2.00 2,70 2,27 2.13 2.16 2,b9 2.06 ,.,e 0.89
2.03
Re<•
l,B8 2.00 1.99
2.34 I.Bl
2.20
2.01
Vaid int
t.n 1.78 1.79 2.00 U1 l.~2
I.OS
U2 0,BI J.4.2 o.ao 0,&5
Shir l
2,50
2.10
uo
0.48
0.56
0.92
l.ll
1.$3
Hu1a
2.89 J.n Ul 3.30 3.38
3.29
J.34 3. 16 2,82 3.09 2.7S 1.99 MT
Pu1a
1.93 2.03 2.07 2.56 2.12 1.79
2.18
2.15 2.20 1,91 2.10 1,48
2.os
s,iu
J,69 2.02 2.u 2.60 2.10 uo
1.99 I.VO 1.99 2.05 1.86 1.51 1.39
1.95
Yau
o~,
1.18 l.80 2.02
2.oe 2.00 2.56 1,89
1.28 1.19 1.78 1,12 J.J6
I.Bl
1.94 1.93 Z.S5 2, 79 2.25 2.00
2.15 2,15 2.1' 2.17 1,93 2.25 1.51 1.10 ue
Yoivoi
1,27 2.00 1.74 2.9B 1.81 I.at
1.41
1.49 1.33 1.28 1.50 1.00
1.65
Tovlsi
1.10 1.11 M2
1.91 1.73
1,25
1. 53
1.20
0.,5
1.53
ffoliuhi
I.BO
2.65
2.13
Z.14 2.13 1.85 1.98
2.10
T.aihi
1.64 1.90 2,35 2.10 2.1e 1.86
2,12
2.27 2,39 1.99 1.88 1,21
1.99
Pol,hu
1.89 1.94 2.51 2.98 2.12 1.45
2,12
2.14 l.91 J.6?° 1.95 1.85
2.06
"ltY
1.81 1.99 2.44 2.83 2.JI 1.88
2.19
1,93 2.01 1.67 2.24 1.56
2,06
6uru
1.00
2.65 2.00
2.20 2,38
1,42
2.11
Sirisiriwai 2,20 I.BS 2,29
2.00 1.20
2.37
Z.50 2.68 2,75 2.80 J.63 1,70 2.16
Sl'ntra
1.93 2.37 2.46 2.81 2,23
2.68 2.58 1.91 1.96 1.BB J.94 1,76 2.00 2.19
tu,u
1,71 1.91 2.80 1.6B 1,35
I.II
1.76 i.57 1,50 I.U 1.22
1.66
Ynhoct
I.BO 1.97 2.16 2.55 2,13 2.00
2.39 2,5(1 2.29 2.30 2.20
1,73
2.17
Kahle
1.93
J.85 2,66 2. 10 l.&O
2.03
lhsa
1.21 1.69 I.74
1.97 1.39
1.63
l,93
uo
1.70
Yun1vuna
2.~o l.00
MO
2.50
1.90
1.55
1.91
1..(~01 fish)
2.00
2.56
2.58 2.65 1.78 2.60 I.OB
2,18
Coroc~ro
"•l•h
1,115 2.86 2,19 2.76 2.00
1.82 1.'1 1.77
1.67 l.!B
UB
2.34 2.n 2.22 I.JO 1,66 1.50 2.12
1,70
lh~roh
2.00 I.BO
1.25 1.•9
1,53
I.JS 1,78 1.70
1.68
Solhoh
1,60 1. 75 I.bl
t.85
I.IS
1.34
1.20
1.50
lil•pia
2.00 2.70
I.Bo 1.75 2.65
2.18
livitivi
1.10 2.00 2,23 Ml 1.98
1.57 1.70 1.11 1.74 2.25 1.45 1.12
1.83
Yavuh
1.65 J.81 2,06 2,10 2.01 2.00
1.85
l.&B 1.72 1,74 I.BO 0.95
I.Bl
Daniv•
I.BO
2,07
1.35
1.74
Vaya
S11110,u1u
1.00
1.67
1.67
22
1. 18
1.~1
1.17 1.32 1,00 0.70
1.50 1.50
1.06
I.ST
r.i.
J.97
2.31
1.'1
2.15 2.10 1.50 2.34 2.10
1.53
2.09
11e,·,
2.3~
2.20
2.25

3.7 Page 27

▲back to top
TABLE 5
HUNICIPAL MARKETS NONFISH PRICE 1987
Hean Price
$/kg
NAV HAU N/CRK SUV LAG KOR SIS NAD LTK M TAV RAK LAB s,w Mean
---------------------------------======::::::::======~=~===:~=======.===----=======================------------------
PRrtWNS
11oci
3,58 3,33 3,48 3.49 3.00
Ura
5.50 4.33
4.29 4.57 3.75
2.25
3.19
9.29 a.11 8.33 B.63 9.00 b,03 5.30 b,43
LOBSTERS
Uraudina 7.00 5.80 5,87 7.33
8,33 8.25 4.00 5.0b
4.47 5.40 b.15
Hana
2.05 3,00 2.30 2,08 1.9a
2.28
CRABS
Gari
3,96 5.45 5.58 5.bO 5.44 5.17 b,66 4.88 5.41 5.78 5.46 5.40 4.45 4.00 5.ZJ
11arivatu
2~50
2.50
Kukaloa
1.97 1.76 2.00 2.17 1.84 1.00
1.32 1,60 1.31
1.25
1.b2
Kukadaau
2.00
2.00
1.49
1.83
lairo
2.00 2.35 2,45 2.13 2.05 2.85 1.10 2.37 2.36 2,19 .1.39 2.09 2,52 2.80 2.19
BIVALVES
Kai
0.29 0.25
0,24
0.24 0.25 0.26 0.24 0.25 (~.30 0.30 0.21 0.22 0.25
Kaikoso 0.26 0.37 0.42 0.26
0.34
0,2B 0,26 0.27 0,27 0.29 0.20 0.22 0.29
KaidaHa
0.56 0.37 0.31
0,27 0.25 0.14 ·0,15
0,29
Gaqa
0.32 0.27
0,30
Kaivadra
0.28
0.28
SigaHale
0,90 0.70 0.47
0,27 0.31
(1.53
Vasuadina 1.87 2.00 2.3b 2,08
1.8B
2,13 2.50
2,54
2.17
K.atavatu
0.50 0.55
2,50 2.24 2.50 0.60
3. 03
1.70
Geqe
1.00 0.23
0,29
0.17
0,90
0.52
Civa
0. 75 O.b5
0.16 0.22 0.19 0,0B
0.34
Kuku
O.B4 0.58 0.46
0.31 1.31 0.28 0.28 0,15
0.53
Civaciva
0.80 0.83
0.25
Oab3
Kaiokalo
Bu
0.50
0,29
0.40
GASTROPODS
Yaga
0.87 0.79 o.&5
0.50 0,50 0.21 0.19 0.20 0.111 0.10 2.54
0.61
Tivikea
2.50
2.50
6olea
0.85 0.50 0.63
0. 28 0.31 0.15 0.23
0,89 1.00 0.54
Sici
1.20 1.50 1.46
0.80
1.50 0.40 J},26 0.10 0.26 2.54
1.00
Tovu
ttadrali
O.bO 0,83
0.50
0.05 0.10
0.26
0.39
·o, ~-o 0.76
0.26 0.28
0.45
ECHIIWDERHS
Dairo
1.03 1.00 1),84 0.88
1.00 1.50 0.58 0,51 0,44 0.38 0.41 2I 77 2.00 1.03
Vula
LOO O.lb
0.88
Loa loa
1.20 1),80 0.68
0.22 0.19 (i.45 0,3(1 0.23
0.51
Cawaki 0.29 0.83 0.85 1.09
0.77
Sucuwalu
0.34
0.26 0.25 0.57 0.25 0.25
0.32
TURTLES
'l f~
Vonudina 2.50 2.33 2.80
1.29 1.31 2,58 1.25 1.05 2,08
1. 91
Taku
2.50
2,50
SEA WEED
Lulliit1a11a
(1,96 1.01 1.00
1.00 0.50 1.00 1.00 LOO 0.50 1.00 1.70 1. 50 1.01
Saga ti
1.00
0.50 I) , 50 1.00
0.75
Nama
0.96 1.01 1.00
1.00 0.50 1.00 1.00 1.00 1.00 1.00 1.b9
1.02
HISC.
Tadruku
0.49 1.13
2.25
3.00 1.00 1.57
1/eata
0.94 1.20 1.30
0.60
3,43 1.23 1.50 1.92
1.52
Ku1ta
2.26 2.21 2.33
2.20 1.00 1.00 1.00 2,00
O,b2 3.25
1.79
23

3.8 Page 28

▲back to top
V,i9hts • 1l
"UNICIPAL "ARKEJS flSH
1987
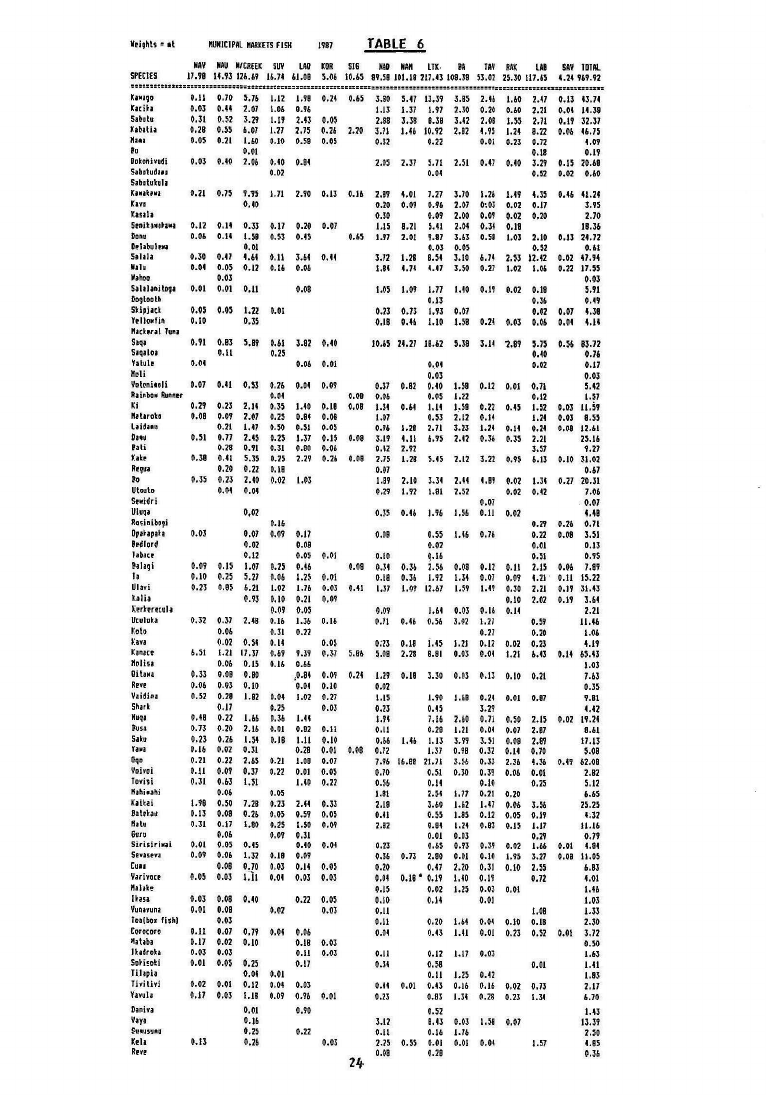
TABLE 6
SPECIES
m NAY NAU N/CREEK SUV ug KOR S16 NAO NAN LTX- BA
RAK LAI SAY 1D1AI.
11.,e 14.93126,H l&,n &I.OB M& 10.65 89.SB 101,18 217,43 108,JB SU! 25,30 m.n 4.24 769.92
:::::::-::~t:1:1z:2:•••••••w•••••••-•2••-~--:--1:--:-:•••••11:•••z:•1:•:z:•z:•••••••-••••••••••••••••-••••••••••:•-zi:1t••1:••czcz••:rz.••,c-••1:•::s
k•••90
0.11 0.10 5,76 1.12 1.9B 0.24 0.65 3,go 5,47 13,39 l,BS 2.11 1.60 2.47 0.13 U.74
hcih
Sahulu
klhlh
Nau
'"Ookoiti•udi
0.03 0,44 2.07 1.06 0,96
1.13 J.37 1.,1 2,JO 0.20 0.60 2.21 0.01 14,38
0.31 0.52 3,29 1.1' 2.u o.os
2.88 3.38 8.38 3.42 1.08 1.55 2,71 0,19 32,37
0.28 MS 6.0l 1.27 2,75 0.26 2.20 J.71 1.46 10.n 2.92 1.95 J.24 e.22 0.06 i&.n
0.05 0.21 1.60 0.10 0.58 0.05
0,0l
0.12
0.22
0.01 0.23 0.72
0.11
o4..0n9
0.03 0.40 2,06 o.10 O.U4
us 2,37 5,71 2.51 0,47 0.40 3,29 0,15 20,69
Sabuludu1
0.02
0.01
0.52 0.02 0.60
Sabulukuh
Kauhwa
Knu
Xasila
0.21 0,75 9.n 1.11 2.90 0,13 0.16 2.89 4.01 7.27 3,70 1.2~ 1.49 4.35 0.46 41,24
0,40
0.10 0.09 0.96 2.07 0:03 0,02 0,17
J.n
O.!O
0.09 2.00 o.o, 0.02 0,20
2.70
Stnihoh•• 0.12 0.14 0,33 0.11 0.20 0.07
1.15 a.21 5.41 2,04 0.31 0,19
18.36
Oa•u
0.06 0.14 J,58 MJ o.n
0,65 U7 2.01 9.17 3.63 0.51 1.03 2.10 o.u 24,12
O•l•huh. .
Sahl•
Wllu
0.01
0,30 0,41 4.64 0.11 3.11 0.14
0.04 0.05 0.12 0.16 0.06
O.OJ 0.05
0.52
0.61
u,3.72 1.28 8,51 J,10 6,11 2.53 12.42 0.02 47.,4
4,71 1.47 3,50 0,27 1.02 1.0, 0,22 17,55
iahoo
0.03
0,03
S1hh•il0g1 0.01 0.01 0,11
0.08
1,05 1.09 1,77 1.40 0.1' 0.02 O.lt
5.91
Doglaath
0.13
0.36
o.,,
Stlpiact
Ytllo•fl•
0,05 0.05 1.22 0.01
0,10
0,35
,.n 0.23 0.73 1.93 0.07
0.02 o.o, I.JI
us 0.46 1.10 1.58 0.24 0.03 0.06 o.o,
"1chral fuu
S1q1
S1qll01
o.91 O.B3 5,Bf 0,61 3,82 MO
0.11
0.25
JM5 24,27 18.62 5,38 3,14 '2,B9 5,75 O.S6 83.72
0.40
0.76
htul•
0.01
0.0& O.Ol
0 •. 01
0.02
0.17
loli
0.03
0.03
Yoloni1oll 0,07 0.41 O.S3 0,26 0.04 0.09
0,37 0,82 0,40 1,58 0.12 0,01 0.11
5.12
Rli•ba• 111,onor
0,04
0,08 M6
0.05 1,22
0,12
1,57
Ki
n,ta,ata
L1i~Hu
Diou
hti
o.e, 0.2,
0.08
0.23
o.o,
2,11
U7
0,35
0,25
1.10
0.11
o.oa
0.08
1.11
U1
0.61
1.11
0.53
1,59
2.12
0,22
0. 14
0..5
1.52
1,24
0.03 11.59
O.Ol 8,55
°"' 0,21 1,47 o.so 0.51 us
1,28 2,71 3,23 1,21 0.14 0.21 o.oa 12.61
0.51 0.11 2.15 0,25 1.37 o.n 0,08 U9 1,11 6,95 2.42 0.3~ 0,35 2.21
25.16
0.28 0.91 0,31 0,80 o.o~
0,12 2.n
3,57
9,27
r.1k•
R•q••
0.38 Ml 5,35 0.25 2.2, 0.26 o.oe 2.75 l,21 5.15 2.12 J,22 o.95 6,ll 0,10 31,02
0.20 0.22 0.18
M1
0.67
Po
0.35 0,23 2,IO 0,02 1,03
J,B9 2.10 J,JI 2,11 l,B! M2 J.31 0,27 20.31
Uloulo
0.04 0,04
0.29 1.92 l.BI 2.52
0.02 0.12
1.0,
S••idri
Uluq•
0,02
0.07
O,!S 0.16 1,96 1,56 0.11 0.02
0,..,0e1
R0sioib09i
Dr••pata
0.03
0.1,
0,07 0,09 0.17
0.2, 0.26 0,71
MB
o.ss 1.16 0.71
0.22 MB 3.51
P•dlard
hbatr
hlaqi
0.02
0.09
0.02
0.01
0,13
o.o, 0.12
o.os Ml
0.10
q.16
0,51
o.,s
0.09 O,JS 1.07 0.25 0.46
o.oe 0.!4 0.36 U6 0.08 o.J? 0.11 2.15
7,89
h
0.10 0,25 5,27 0.06 1.25 0.01
0.18 0.36 1,92 1.31 0.07 o.o, ,.21 · 0.11 IS.22
Ulavi
0.21 o.es 6.21 I.OZ 1.76 0.03 0.11 l,!7 1.09 12.67 1.59 1,0 0,30 2,21 0,19 31.43
hlia
X•rhrrcuh
Uculuka
0.93 0,10 0.21 0.09
o.o, o.os
0.32 0.37 2.48 0.16 1.36 0.16
0.10 1.02 0.11 J.64
0.09
J,61 0.03 o.t, 0.14
0.71 0.46 o.s, J,02 1.21
0.59
2.21
11.46
Koh
r.,va
Kan1n
0,06
0.02
u,
O.JI
0.14
0.22
o.os
0.27
0,20
0;13 0.18 i.45 1.21 0.12 0.02 0,23
J.06
1.19
6.Sl 1.21 17.J7 0.69 9.39 0.37 S.B6 s.oe 2,28 8.81 0.03 0.0! 1.21 6,43 0,11 65.43
N~lis1
OihNi
0.06 0.15 0.16 0.66
0,33 0.08 0.BO
,0.81 o.o, 0,24 J.19 0.18 3.30 0.03 0,13 0.10 0.21
J.03
7.63
Rrvo
0,06 O.OJ 0,10
0.01 0.10
0.02
0.35
Y1idioa
0.52 0.28 I.Bl 0.04 1,02 0.27
1.15
1.,0 1,6B 0.2, 0.01 0.87
9.81
Sharl
0.17
0.25
0.03
0,23
0.15
3,2?
1.42
Nuq1
0.18 0.22 1.66 0.36 1.41
I.fl
7,16 2,60 0,71 o.so 2.n 0,02 JUI
Pusa
0,73 0.20 2.16 0.01 0.82 0.11
0.11
0.20 1.21 0,01 0,07 2.87
8.61
Saku
h•I
Oqo
Yoivoi
Tovhi
0,23 0.26 1.51 0,18 1.11 0,10
o.&6 I.I& I, 13 3.99 3.5! MB 2,89
0,16 0.02 0,31
0.2B 0.01 o.oe 0.11
I.JI o.9e 0,31 0.14 0.10
17,13
5.08
0,21 0.22 2.65 0.21 I.OS 0.07
7,96 16.88 21.71 3.56 0.33 2.36 1,36 0,49 62.0B
0,11 o.o, 0.37 0.22 0.01 o.os
0,31 0,63 I.SI
1.10 0.12
0,70
0.56
o.u O.Sl O.JO 0,3! 0.06 0.01
0.11
0.25
2,82
S.12
"•hiuhi
0,06
0,05
I.Bl
Ml 1,77 0.21 0,20
6,65
XaHli
hhh~
N1lu
Guru
Sirisirhral
Snalina
Cu•u
Y•rivaco
J.98 o.so 7,28 0.23 2.11 0.33
0.13 0,08 0.26 0,05 0.59 0.05
0.31 0.17 1,80 o.25 ,.so 0.09
0.06
0,09 O.ll
0.01 o.os 0,15
0.40 0,04
0,09 0.06 1.32 0,18 Q.09
o.oa 0.70 0,03 0.11 0.05
o.os 0.03 1.lt 0,01 0,03 0.03
2.18
3,60 J,62 J.47 0.06 M6
25.25
o.u
0,55 I.BS 0.12 0.05 0.19
1,32
2.82
0.81 1,21 O,Bl 0.15 1,17
Jl,16
0.01 0.03
0,29
0,79
0,23
0,65 0.,3 0.3! 0.02 1,66 0.01 4.81
0.16 0,73 2.80 0.01 o.a 1.95 3.27 o.oB 11.05
0.10
0.47 2.20 O,JI 0.10 us
6,BJ
0.81 0.18 • 0.19 1.40 0.19
0,72
4.01
"•hi•
llisa
O.OJ 0,08 o.io
0.22 o.os
Yun1vun,
0.01 0.08
0.02
0.03
loa(bar fish]
0.03
Corocoro
0.11 0.07 0,79 0.01 0.06
"•hb1
0.17 0,02 0,10
0.18 0.03
lhdrah
0,03 0.03
0.11 0.03
SoH!oti
0.01 0,05 0,25
0.17
Jihpia
livilivi
0.01 0,01
0.02 0.01 0.12 o.o, 0.03
Yivula
0.17 0.03 1.18 0.09 0,96 ~.OJ
0,15
0,02 1,25 0,03 0.01
1,46
0.10
O.H
0.01
1.03
0,11
I.OB
J.JJ
0.11
0,20 J.64 0.04 0.10 0.18
2.30
0.01
0.13 1.41 0.0! 0,23 Ml 0.01 3.72
0.50
0.11
0.12 1,17 O.OJ
1,63
O.ll
MB
0,01
I.II
0.11 1.25 0,42
l.83
0.11 0.01 0.43 0.16 0,16 0.02. 0,73
2,17
0,23
0.03 1.31 0.28 0.23 I.JI
6.70
Daniv1
0.01
0,90
0.52
1.43
Yay1
0,)6
J.12
e.u 0.03 1,51 0.01
IJ.39
Su•us!Jllll
0,25
0.22
0,11
0,16 1,76
2.so
Kth
0.13
0.26
0.03
2.15 0.55 0.01 0.01 0.01
1.57
4.85
Rn•
MB
0,28
0,36
211,

3.9 Page 29

▲back to top
TABLE 7
Weights= •t
KUHICIPAL ~ARKETS NDNFISH 19B7
HAY NAU N/CREEK SUY U'iQ KOR 516 NAD LTK BA TAV RAt: LAB SAV TOTAL
53.42 180.12 14.88 427.bl 5.23 39.78 48.80 100.79 248.bb 112.8b 51.60 24.50 26,94 1.b9 133b.89
---===================================================================================================================
PRAWNS
Moci
0,31 0.01 0.23 0,62 0.01
Ura
0.02 0,06
0.37 (1,31 0.26
0,(12
1.20
o.u 0.12 0,51 0.23 0,07 0.02 0,51
2.6(1
LOBSTERS
Uraudina 0.04 0,02 0.16 0.40
0.08 0.21 0,02 0,16
0.64 o.oa 1.81
Ilana
0.85 0.77 23,21 0,65 0,94
26.42
CRABS
fiari
1.16 3.17 1.40 5.69 3.33 0.38 1.59 1.19 2.26 1.58 0.52 0.18 3.54 0.08 26.09
Oarivatu
0.05
0.05
Kukaloa
2.99 0,24 5.15 0.17 0.55 0.10
0.78 0.66 0.87
0.09
11.60
Kukada1u
0.24
0,02
0.46
0.72
lairo
0.0B 1.b2 0.05 1.07 0.13 O.Ob 0.10 1.51 1.79 0.23 0.39 0.30 o:b9 0.12 8.14
BIVALVES
Kai
50.61 161.15
355,07
34.90 45.14 74,93 199.01 96,52 38.01 16.92 8.53 0. 39 1081. 18
Kaikoso 1.26 6,74 4.98 21.20
1.20
2.99 4.99 2.13 3.05 1, bt) 7.b2 0.43 58. 19
Kaidawa
0,10 0.3b 0.12
1.03 1.77 0,49 0.47
4.34
Gaqa.
0.50 0.52
1.02
Kaivadra
0,12
0.12
Sigaule
O,Ob 0.2b 0.57
(1, 71 0.64
2.24
Vasuadina 0,05 0.09 0,42 1.13
0,25
1.56 0.12
0,39
4 ,01,
Katavatu
0.15 0.09
0.17 2.57 0.12 0, 17
0,70
3,117
Qeqe
0.01 0.01
O,bO
0.05
0.37
1.04
Civa
(1.08 0,10
0.22 0.32 0.28 0.05
1.05
Kuku
0,14 0,21 0,59
1.37 1.91 0.64 1.(14 0.10
6.00
Civaciva
0.02 0.14
1.97
2. 13
Kalokalo
Bu
0.01
0,12
0.13
GASTROPODS
Yaga
0,24 (1,86 0.51
o. ~2 0,05 1.33 1.93 0,77 0.68 0.10 0,37
b,Bb
Tivikea
(1. 02
0.02
6olea
0.06 0.01 (I.lb
1.90 2,13 (),08 0,55
0,11) (1.09 5.08
Sici
0.61 0,61 0.99
0,29
0,08 1.70 0.64 0,29 0.?1 0.50
b, 42
Tovu
0.34 0.23
0.01
0.06 0.24
0.82
1. 70
Hadral i
0,03 0.31
1.24 1.56
3.14
ECHINODERHS
Dairo
0.06 0.30 0.57 2,07
0,16 0.10 6.22 15.29 4.40 4.26 2.81 0,68 0.24 37.lb
Vula
loaloa
0,01 0,09
0.04 0.16 0,14
0.10
1
0,72 1.17 0.16 0.29 0.07
2. 75
Cawaki 0,07 0.08 0.72 1.55
2. 42
Sucuwalu
0.06
0.60 0.42 0.72 0.22 0.05
2.07
TURTLES
}-<.,°'i
Vonudina 0.05 0,21 0,31
0,88 0.97 0.53 0.10 0.44 1.07
4.56
Taku
0.07
0.07
SEA NEED
lu1i11awa
0.47 0.04 1.82
0.01 0.52 0,31 0,56 0.20 0.1.2 0.10 0.42 0.12 4.69
Sagati
0.02
0.19 0.08 0.06
0. 35
Nata
NISC.
0.43 0,47 2,32
0.42 0,60 o.~1 0.70 0,17 O.j2 0.10 0.32
6.16
l adruku
0.20 0,16
0.16
(1.01 0.03 (1.56
Veata
0,04 0.69 (1,61
0.01
0.61 0.49 2.01 0.12
4.58
Ku1ta
0,30 0.32 1.65
0.22 0,60 0.26 0.31 0.10
0.1B (1 .20
4.14
25

3.10 Page 30

▲back to top
TABLE 8
YOLUNE OF FISH SALES AND VALUE,;, PER DIVISION BY NAJOR FAKILIES
CENTRAL DIVISION
WESTERN DIVISJON
NORTHERN DIVISION
IEASTERN DIVISION
Karkets
Yalue
Outlet Total (OOQ)
Value
l Karkets Outlets Total (000)
: Narkets Outlets Total
Va!ue
(000)
.
I
1'
Value
Outlets {000)
242.48 2466.63 2709.11 7154,39 : b05.55 570.65 1176.20 2819,38: 121.89 678.83 800.72 1447.82 i 24,22 42.34
----------------------------------------------:----------------~---------------:-=-------====---=====--======= =:==========- =-~==
Lethrinidae 39,H 4~3.97 49J.7b 1550.41 : 102.09 84.6b 186.75 498.62 I 20,91 159.85 180.76 363.33 / 2.60 5.20
Serranidae 19.85 277.17 297.02 1018.78: 63.81 51.61 115,42 3n.u: 7.93 75,64 83,57 180.51 : 1.38 2.98
Sco11bridae 12 .05 207,53 219.58 500.64 : 53.94 118.59 172.53 424.42 : 10.45 141.29 151.74 241.27 : 0,93 1.49
Carangidae 14.37 129.25 143.62 336.07 : 69.74 62.15 131.89 311.26 1 7.56 17,81 25,37 46,43 : 0,65 1.19
Hull id~e
8.00 27,93 35,93 103,12 l 9.32 3,39 12.71 26.1B : 2.82 7.02 9.84 14,07 l 1.37 1.96
lutjanidae 24.43 256.27 280.70 684,91 / 74,88 76,09 150.97 3B3.4o; 9.13 53.89 63.02 98.94 l 3,48 a.46
Ac anthuriciae 9.14 48.11 57,25 138,55 l 7.87 4,50 12.37 28.33 : 7.04 9.77 H,,81 21.68 : 0.00 1.03
Scaridae
11.43 105.43 116.86 282.80 : 19.03 20.08 39.11 72,74 l 4.61 65,93 70,54 109,34 : o.ao 1.24
Polyne1idae 5.28 65.66 70.94 159.62 I 8,87 11.01 19,88 43.34 l 2,16 12.47 14.63 U,53 : 0,42 ().47
llugilidae
37,91 437,90 475.81 1160,52 : 20.00 19.46 46.26 117.04 I 7.00 44.31 . 51.31 97.49 : 4,87 9.25
Siganidae
4, 16 52.64 56,80 190.85 I lVH 2.13 15.04 48,88 I 2,17 6.15 8,32 15.39 : 1.20 2.22
Sphyraenidae 4.44 58.28 62.72 151.78 l 52,79 lb,Ob 68.05 147 ,34 I 4.85 14.98 19,83 29,75 I 0,50 (),75
leiognathidae 12.76 108.27 121.03 311.05 : B.93 2,93 11.86 26.21 I 3.56 1.50 5.06 b,12 : 0.10 0.12
Theraponidae 2.47 8. 72 11.19 23.61 ; 5.30 0,65 5,95 12.91 : 0.21 0.13 0.34 0.30 l 0.10 0,09
Chanidae
84.35 84.35 167.01 : 3,60 0,78 4.38 7.23 : 0.70 3.01 3.71 5,05 : 0,34 0.46
S1oked Fish 0.47
0.47 1.65 l
o.oo 0.05 : 20.85
20,85 58,07 I
Salted Fish
2.13
2.13 12.35 :
nisc.
35.93 145.15 181.0B 375.02 : 85.67 96,56 182.23 338,95 7.81 65.08 72.89 131..20 I 4.68 8,42
11kt Hkt Outlet Outlet
Tot Value Tot Yalu!!
969.92 2327.73 3740,33 9136.20
=======;===. == ~----====---===----==-----==---
lethrinidae 162,79 439.55 701.08 1978,01
Serranidae 91.59 268,99 405.80 1265.69
Scoiabridae 76.44 176.78 4~8.34 q91,03
Carangidae 91.67 212.05 209.86 482,90
Mui lidae
20.14 4b,19 39.71 99.14
Lutjanidae 108.44 264,14 389.T3 908.b4
Acanthuridae 24.05 49,22 63.18 140.37
Scaridae
35.07 70,20 192.24 395.92
F'olyne11idae 16.31 33.66 89.56 186.30
!1ug i lidae
71.71 175,88 506,54 120b.77
Siqanidae
19.24 59.95 b2,12 197.39
Sphyraenidae 62.08 130.99 89,82 !98.63
Leiognattiidae 25.25 56.84 112.80 286,67
Theraponidae 7.98 16,90 9,bO 20.01
Chanidae
4,3(1 b,89 88.48 172,86
S!!!oked Fish 21.32 ~9.73
Salted Fish 2,13 12.35
Hise.
129.41 247.42 Jll.47 60:i.B8
26

4 Pages 31-40

▲back to top

4.1 Page 31

▲back to top
TABLE 9
VOLUHE OF NON FISH SALE &VALUE••• PER DIVISION BY HAJOR GROUPS·
CENTRAL DIVISION
WESTERN DIVISION
NORTHERN DIVISION
Market Outlets Total Value : Harket Outlets Total Value : Harket Outlets Total Value
Harket l!l(Nt} Wt(Nt)
$ : Harket Wt{l1t) tlt{Ht)
$ l Wt[Hti ilt(Ht) Wt (Nt)
$
721.04 405.95 1126.99 750.82 l 586.88 115,25 702.13 717.14 : 28,l,3 b9,11 91.64 286.11
===================================================================================================================;=====-
Crustaceans
56.77
32.73
89,50
354.71
I
I
15.95 101,36
117 ,31
495.70 :
5.91
25.97
25.78 114,03
Bivalves 642.0b 323.72 965,78 303,81 l 503.93 12,18 516,11 164.63 : 18.SS 9.43 27.98 10.25
Gastropods 5.2B 1.12 6.40 10, 50 l 16.86
16.86 4.47 : 1.08 1.06 2.14 4.87
Echinoderas 6.0B 48,02 54.10 60.65 I 37.50
37. 50 20.56 : 0,92 23.73 24.65 121.57
Sea Need
6.01
6.01 6.63 l 4.34
4.34 3.59 : 0.86
0.86 1.26
Turtles
0.64 0.33 0.97 2.72 : 2. 92 1.18 4.10 15.56 : 1.07 7.82 8.89 33.45
tlisc.
4.20 0.03 4.23 11.80 : 5.38 0,53 5.91 12.63 : 0.24 1.10 1.34 0,68
Hark et Harket Outlets Outlets
Wt(Ntl Value Wt(Nt) VaJ-ue
1336,89 718,Bb 590,31 1035.21
================~=============~==================
Crustaceans 78.63 360.69 160.06 603.75
Bivalves 1164, 54 286,99 345.33 191.70
Gastropods 23.22 12,18 2.18 7.bb
Echinoderms 44.50 25.03 71.75 177. 75
Sea weed
11.21 10,48 0.00 1.00
Turtles
4.63 7.38 9.33 44.35
Hise.
10.16 lb,11 1.66 9.00
27

4.2 Page 32

▲back to top
YOLUHE Df FISH SALES 1HROU61l ourms IN 1917
TABLE -10
CEMTRAL IIYISION mo.33
111,S]ERN PIVISIDN 481.09 llllRINERN DIYISIDN l7J,01
Haiti ~ulchor Shop Rod NnA Au,, Hal,I Mchor Shop Rod Hotd Mch" Shop lfflA EASTERN TOTAL
Rn~t•J FIi Supokt sidt
Uoil R.,l,11 F/4 SupoH ddrs Rnlt1! f Id SupoH
Wli9bt (NlJ 36.52 10&7.93 214.94 1101.10 27.16 11,98 169,14 n.01 55,U 769,51 10,7& 02,61 80,21 ,i,21 21.22 3710.31
::::::::11::l::;===;::::a::::::::========:;::;=:;:;:::;:;;::z:::2:::::=:::::::::::::::,::~====:.=:=:::=:::;,;,;:::;::::s:::::::::::.:::,::::=;-:::::,:ai::i=::::::!!::::::=;
Km90
luih
1.08
0-90
11.n
22.65
J.07
1.15
68,17
1.n
0.91
1.21
1.31
0.21
4.24
2.08
3.71
1.10
I.el
1.40
9.55
2.11
0,70 15.56
0.90 16.fO
2-81
2.93
J.1'
0,90
0.31 192.lO
0.23 65.JB
S1l<rlu
0.81 SB.I& 1.&1 11.09 1.0 0.67 7.18 !.~o 1.31 t.52 0.91 16-61 l-80 0,99 MO 122,8!
l"ab1li1
""f···
~-•~ M6 IG.80 1,91 6',11 1.20 0.73 o. 18 1,56 1.80 6.36 0-89 18.53 2.10 0,12 0,19 116.25
Ml 8.90 2.30 5,65 1.0,
o·.tr
1.~8 1.21 1.21 M6 13.16 1.20 1.13 0.10 38.)6
0--:10 0.01 0.20 13.10 1,60
i5,911
Po~onhvdi O,J7 3.22 Z,98 11.13 1.00 0:11 1.10 1.10 0.10 S,83 0.39 11,14 1,30 3.36 0.30 5Ul
S1Mud11u
S1b•,luluh
~·a••••w.1
~nu
I.JO
0.67
0,26
,.n 0.1~ 1.30 I.JO 1.20 0.03 11.10 1,05 0,21 0.31 ll,53
1,20 o.eo ua
1.20
o.u 2.18 87,50 15.18 98.11 l,21 0,55 11.20 !,09 _I ,16 11.73 0,78 28.71 3.10 8.10 o.u 280,61
0.80
o.61
1,18 0.12
0.10 O.ll 0,62
I ,91
0.SI
6,ll
hnl•
1,20 0.P1
1.20 I.ID 0.38 o.u 0.11
U6
M9
Sf11ili1111h111
5,76 0,89 I.II
1,13 0,11 O.JO 0.01 0,23
1.10
0,13 11,'1
Darut
1.1B 20.18 1.16 2J,95
0,51 2,68 1.22 2.16 10.73 0.11 16.10 1.30 1.,a 0.50 92.06
D!hlut. .,
Slhl•
0.50 0.05
2.13 ,o.,a UI 11.46
0.20
o.n 0.10 2.69 0.10 0,25
1.32
0.01 0.31 0.21 0,JI 21,19 0.01 65.68 4.65
0.10 203,16
N1lv
3,18 51.32 2.20 0,31 0.05 I.Bl 19.96 12,15 J.lO 1.91 0.90 38.11 1.90 1.12 0.21 191,56
h~oo
1.85 U2 -o.o,
3.02
0.01
O.OB J.15
0.23 0,16
12.11
5111hoi1091
0.11) 1.20
0.11
I.JO O.lO 0.02 0.01 3.20 o.ao 0,05 0.12 ID.JI
Ooglootb
MS 0.16
0.11 0.36 o.oe 0.06
0,10 2.21
3,20 0.10 0,56
us
Sti,i1cl
0,16 0.50 2,JO 0,33
0.12 0,10
1.10 MS !.~ MO 0,13
1,05
rtll..lio !,JO 0.02 o.so O.JI 0.72 0.22 0.22 0.10 0,20 0.17 0.JO 3,20 0.,0 0.11 0.20 8,76
u, fttchnl T••• 2.45 U3 1,30
11.12
1.23
I.~
31,12
z.s, S1qi
41,60 16.98 19.(0 0.65 2,U 20.68 5.02 1.12 16,19 0.20 •6,90 0,20 5.91 0.15 m.l,
S1q1!01
htul•
0.12 0.07
o.,a 1.21
12,36
0.01
2,JO
11.85
0.10 5,36
~oli
Votoniooli 0,06 I.SI 0.1, 1.51
0,06
0.10
1.55 0.01 1.18
0.10 1.21
R1i1tMwR11nn1r
ti
0.12
o..t••··· 0.06
lall11g
o.n
O•••
0,26
0,68
4,23 1.23 8,31
MO 0,10 9,82
1.10 1.11 15.11
6,75 8,97 30,89
O.OJ I.II
0.05 o.o,
0.25
0.20 1.21
0,31
0.01
2.1,
0,30 0,50
0,25 16,19
0.02 0.01 0,50 0.50 0,21 0.06 2.11 0.30
0.52 18.12
0.16 0,21
0,12 0.01 J.61 0.04
0.60 5.01
Ml 1.10 I.JO 1,18 1.18 MO 12.00 0,10 O.SI o.so 11.,1
ue J.00 1.s6 5,11 0.,0 5.61 0.10
0.16 61.01
hli
0,35 1.23 1,10 21,00
0.12 l.90 1.00 1.11 7,lZ MO 5.25 0,70
0.31 lf.46
K,h
1.19 21,80 i.81 56.11
O.OI 0,38 1.56 J.91
1.20 0.60 0.26 0,60 100.91
Rf1'H
lo
Ul••l•
Su11,l,d, ri
2.30 UI 0,39 O.ll
0.11 0.24 0,32 1,31 l.OS 0.05 0.11 MO
0,32 11,96
0.10 11.91 l,51 16,ll
0.51 G.50 0.22 2.01 1.es
1.11 o.,o 0,71 0.56 U.20
o.u 1.12 $.II 0.8' 0,06
Ul 2.21 I.OS J,3J
1.30 o.so 0.10 0.60 18.16
0.09 1.13 1.06
0.01 1.10 1,10 1.06 1.31
1.15 o.,o 0,31 0.10 "65
1.62 0,01 l.56 0.10 0,26
6,U
ffolinilla,i 1.12 1.09 0.7'
0.01 l,JO l,06 1,10 uo 0,01 3.91 o.ao 0,69
IJ.90
Opahp1h
P,trord
1.02 1,0l O,IS
1.21 0.02 2.10 1.30 O,M 1,11
o.ss 1.01
0,31 1.11
1.90
0.50
1.2S 0.9' I.ii
1.8! 0,70 0,21
ll.88
B.7B
Tab,c,
0,0l 1.00 2,16 0.01
o.so
2.90 O.ll
0.10 7,35
hl•?i
h
Ulni
klli,
2Z,II 0.18 7.26
0,05 3,13 0.12 10.01
0.13 lO. 51 1.10 41.91
l.06 1.53 0.04 0.01
O,Ol Ml 0.10 D,71 0.7B
0.11 0.10 0,06 0.16 1.12
,.uI.OS 0.21 O.ll 0.10 36.01
1.08 0.01 0.50 19.I~
0.12 0.14 0.12 13.12 0,8! 1.91 0.,0 o.n MO 118,66
u e 0.01
l.l6 3,32 0.21 0,06 21.7! MS 36,31
13.51
rrrl:rtttcul,
0.01
0.06
0-&B
0.41 0.01
0.03 1.31
UtuJ,Jh
r.oto
1.03 O.lt IMS
S.,8
o.,, 0.08 0.16 0,12 0.01 I.SI 0.30
0.10
0.20
O,Ol 19.10
0.07 7.81
rm
1-61 6.10
Ml 1.01
0.31 1.98 0.01 2.51 0,30
1.20 17.01
~a11u,
1.12 203.98 32.36 181.56
3.10 1,43 0.18 7.55 0.02 28,92 12.00 0.29 3.60 481,11
n,li,a
0.21
0.21
Qih••
Rn,
V,idioa
1.01 1.38 3,l5
0.16 o.Gl 0.15
0,11 0,02
0.10 6.85
1.10 1.n
0.22
1.05 o.u Ml
0.02
2.15
o.n
0.03
0,20 1.n
5hirl
0.23 0,50 0.31
0,29 0.02
0.16 us
0.1!
5.90
"•4•
0.20 31.51 0.06 16.91 0.85 0,08 uo
1.53 0.01 3,60 2,40 0.11 1.20 ,2.12
tuu
_Q.70 UI I.I&
0.01 0.40 ~.oe 0.11 0,89
2.81 J,O
0.40 U,51
S,\\u
0.21 4.08
O,Ol
0.19
0.9~ 0.90 0.01 0.10 6.16
Yi111
3.0& 3.57 75.91
1.18
O,IB 0.2, l,OS I.II
0.31 81.18
Oqo
VciYci
fo,·hi
N1hiuhl
hlk,i
81tohu
N,lv
Guru
Sir hiri•ai
Stn1n•
tvoo
YirhocP
N1hlt
0.11 35,B9 5,98 16-22
o.u l.61 0.11 1.01
0.31 1.13 0.01 13.57
2.06
23.57 1.26 8D.IO
t.09 1.10 2.,0
1.03 o.n 11,10
Ml 2.10
0.10 0,03 1.90 3.60
0.12 11,01 3.30 1.32
2.10 3,ll
l.87 10,73
0.03
0,05
0.08 8.12 !.02 1,14 i.,e
0.00 0.21
6.81 3.10 1.18 o.so 19.81
o.n
7.27
0.73 1.12 6.01 2.16 II.IS
0.30 0.02
1£.82
0.01
0,11
1.20
0.05
6.19
0.04
l.93
1,3! 0.20
0.10 112.eo
0,25
3.20 0.JO
0-2! 8.61
0.01
0.91
1,4' 0.20 0.06 MO -22.61
0.01
o.os 0,10 1.10
I,Bl Ml J.20 0.30
0.30 1,8S
0.11 0.51 5.20 0.80 o.oi 0,23 11,51
0.02 1.20 1.71 3,50
6.10 0.90 6.70 0.15 39.89
5.20 0.10
0,15 11.51
0.60 1.01
I.SI
1.67 o.,o 1,46 0,50 24.18
0.08
0.25
o.u
lhsa
Vunnunil
lo1(bo1 li<hl
J.11
MO
0.01
O.Sl 0.22
t.19
0.61 0.08 o.oe 0.10 1.13
Coroc0ra
N,hb•
lh~roh
5othoti
Ii h1i•
livilivl
fui,b
v.,•.t-1rtin
Su11nvu
r,11
.03 1,78
1.n O.Ol
0.2& 7J.IO 73.15
3.7&
0.90 1.20
0,02
2.0 0.20 0.02 0.20 IMI
0,12
O.ll
O.IB
Ml
0.01
0.18
o.o, 2.13
0.01
0.04
1.90
MB
o.95 1.51 0.21
8.00
6.n
0.3~ Ml
0.10 7.33
3.07 0.15
0.36
3.SB
1.20
11.39
O.lO 12.89
2.98
0.10
0.10 3.11
5.61
0.10 1,10 0.JB 8.76
,.er 0.10
0.10 70.45
28

4.3 Page 33

▲back to top
TABLE 11
YDLUNE OF NON FISH SALES THROUGH OUTLETS IN 1987
Central Division 405.95
Western Division 115.25 Northern Division 69.11
Hotel Butcher Shops Road
Aux Hotels Butcher Shops Road Hotels Butcher Shops Road
Total
Res&Caf F/d Sp1kts Sides NNA Unit Res&Caf F/d Sp1kts Sides Res&Caf F/d Sp1Hs Sides NHA
WGT/NT 11.76 10.96 1.47 322.62 0.14 59.10 21.04 4.27 0.1B B9.76 1.14 U.67 6.50 3.18 16.62 590.31
=============================================================:====================================~====~=========:::;:====
PRAWNS
Hoci
0.41
Ura
3,16 0,24 1.21 0.79
0.06
0.47
3.99 1.12 o.oe 2,29 0.45 0.67 2,29 0.18 1.08 17,53
LOBSTERS
Uraudina 2.84 0.59 0,13 0,05
0,15 10,90 0.04 0.08· 8.96 0.45 2.61 2.22
1.29 30.31
Nana
CRABS
Qari
5.52 5.00 0.13 12. 51
2.52 2.90 0.02 68.26 0.24 11.26 1.99
1.24 111.~9
Oarivatu
Kukaloa
0.14
0.14
Kuhdaau
Lairo
0.02
0.02
BI-VALVES
Kai
0.11
308. 55
1.94
10.04
3,00 0.77 324.41
Kaikoso
0.21
0.21
Kaidawa
11aqa
t'ai vadra
Sigawale
Vasuadina O.OB 4.98
0.02 0.02 9,19
0.20
3.16
1.20 18.85
Katavatu
1,30 1.30
lleqe
Kuku
Civaciva
0,56
0.56
Kalokalo
Bu
GASTROPODS
Yaga
Ti vikea
8olea
Sici
0.02
1.10
1.06
2. 18
Tovu
Hadrali
ECH INODERl!S
Beebe De lie
0,03
47.99
16.21
7.52 71.75
Vula
Loaloa
Cawaki
Sucuwalu
TURTLES
Vonudina 0.05 0.05
0.12 0.11 l.18
6.70
1.12 9.33
Taku
SEA IIEED
Lu11i11awa
Saga ti
Naaa
IHSC,
hdruku
Veata
Kuita
0.03
0,52 0,01
1.10 1.66
29

4.4 Page 34

▲back to top
TABLE 12
ftUNICIPAL MARKETS AND OUTLETS 1987
============================================
-==============-====================================================================================
COKKERCIAL AND ARTISANAL
11
II
Fri;sh Fish
11
II
Non - Fish
11
11
Smoked
l
Salted
Fish
II
II
PRODUCTION
l: W!!ight Value 1'1' Weight
Value
II
11
Weight
Value
II
II
-----.A.--------------------:••--------:-------~-;;-----------:-----------~: -----------;-----------::
CENTRAL DIVISION MARKETS
11
II
II
11
II
II
Suva
16.74
I
I
47,81
11
II
427,bl
I
I
235,08 : :
LOO
I
I
2.16
I
I
Nabukulau Creek
126,691
324.38
11
11
14.88 l
22.38 : :
Navua
17.9B
I
I
35.32
11
II
53.42 I
20.63
11
11
0.02
I
I
0.04 /
laqere
Nausori
61.08 l
14.93
I
I
143.93
11
,1,1
35. 14 11
5,23
180.12
21.76
11
II
92.83 ::
0.90
I
I
2.15:
Korovou
11
II
5.06
I
I
9.97
II
II
39.78
lb,51
11
11
0.65
I
I
1.31 ;
WESTERN DIVISION
MARKETS
11
II
II
Ii
Ii
I
II
11
Sigatoka
Nadi
II
'
10.65
I
I
21.13
11
II
89,58
I
I
215,75
iI
Ii
48.80
100,79
16,90 l
52.16
0.72 I
0.98
I
I
1.44 II
0,34 l I
Na1aka
101.18 1 245.19 !l
11
11
Lautoka
Ba
217.43
I
I
521.01
iI
11
108.38 l
268.87
11
11
248.66
112,86 :
99,46
57.09
0,79
I
I
2,20 :,:,
II
Tavua
53.02
I
I
112,41
11
11
51.60
I
I
26.22
11
II
RahRaki
25.30 l
b0,8b
11
II
24.50
I
I
15,87
11
11
NORTHERN DIViSION KARKETS
I
II
11
IJ
11
11
11
11
Labasa
11
Ii
117 .6~ :
198.39
11
II
26.94
I
I
39.10 l:
22.19
I
I
68,04 : I
Savusavu
11
1I
4.24
i
I
1.n 11
II
1.69
I
I
2.87
II
11
0,73
I
I
1.76 li
------------~-----------------------------1t,------------------·-1-----------J-,-.----------•-,-------------J1,-----------1·--------------------11,
Sub - total
11
II
969.91
I
I
2247.91
iI
II
1336,88
I
I
718.86 ,11,
27.08 l
79,44 : :
=====::;:::::::;:::========::========~]=========::===========;=:=:=======::===========:===========ii
CENTRAL DIVISION OUTLETS
JI
I;
ti
11
11
II
II
II
Hotels Rests &Cafe
11
II
36.52 l
11
11
11.76 l
iI
II
11
11
Butchers &Fish dealers
11
II
1067.93:
11
tI
10.86 :
11
tI
11
11
Shops &Supermarkets
II
11
214.94 l
1.47
I
I
11
II
II
11
Roadsides
lI
II
1101. 10
:
322.62
I
I
11
11
11
II
rHIA
11
II
27 .16 l
0,14
i
I
II
11
11
II
Auxillary Unit
18. 98
i
I
59.10
I
I
II
11
11
II
WESTERN DIVISION MARKETS
11
11
Hotels Rests &Cates
169.84
I
I
21,04
I
I
II
11
Butchers &Fish dealers
76,04
I
I
4,27;
11
IJ
Shops &Superarket
55 .19 'I
0.18 I'
11
II
Roadsides
269,57 1
89.76 l
II
II
NORTHERN DIVISION OUTLETS
II
11
11
1I
Hotels Rests &Cafe
11
II
1(1,76 l
1.14
I
I
II
II
Butchers &Fish dealers
,I ,I
492,61
I
I
41.67
I
I
I
II
11
11
Shops &Superarkets
11
II
80.24 l
6.50:
II
II
J' 'I
Roadsidl!s
II
II
3.18:
11
11
11
11
NMA
11
11
95,22
I
I
193,17
I
I
16.62
I
I
38,00
iI
II
JI
II
EASTERN DIVISION OUTLETS
11
II
II
11
II
II
Lakeba
iI
11
19.62
I
I
11
·11
II
11
Levuka
iI
11
4.60:
II
11
11
Ii
II
11
=====· =====================~~========;: ====:====::===========:==========✓; ~===========:===========:~
Sub - total
:: 3740.32 l
11
II
590.31 :
11
II
lI
11
Weights = 11t Value= $000
30

4.5 Page 35

▲back to top
TABLE 13
EIPIIIIT OF FISHERIES PRODUCTS - 1917
Unit
Vu;inlity f Ydut
:zz:::::::::;s::z-z::::z:z:zssszz:::z:asz-srr;:::::::s:::::::s:":1::::::::c:.:::
fish, Lin
lllol
United kingdOI
9,975
21,029
Unihd ShtH
56,m 63,188
Nethtrhnds
6,300 11,m
&eruny,FederII RtJ)<Jblic
B,74'
35,781
Ci1n,d1
New Zuhnd
760
2,874
m
3,004
Unit
lluntity f Ydut
•s--·----------:i::i-·=·••::s::1r~-:1.s-z:·-:-s::--i:-:.----:------ . . --:r
Othtrs (Including Cords etc)
Hn Zulilnd
450
USA
57,568
Western Sua,
2,500
J;ip;in
69,740
Karn Rep, of
4,298
HongK0119
1,800
--------T·-o-t&-!----------
I Fhh,Frtsh or tllilltdllg)
Austnlh
United Shtu
C1n1d1
13,lO'I 143,731
2,331
39,693
808
11,025
264,055
2,115
Tot1I
-....
........... __
.,.
_____42,822
..,
_____2_7.7..,.8..9..5...
C Fish,frDZ,-, )Rel Flllth1
Frnh1 t~Uled or Froz111 IKtl
Austnliil
CH1d1
Aircrdl I shipt start
llllitttl Shhs
Chill Tlilflll
J1pan
N111ru
llttl lt1hd
26,m
5,501
50
6G,9'14
50f
24,223
25
2,632
119,300
17,641,
200
359,753
1,336
144,541
38
11,135
TGhl
120,m 653,949
Told ------------..
K CruslacHH ind
IKgl
NolluscH·Live
C111i1di1
114
J1piln
Austrilliil
41
__,._____1_,4_0_0
Tohl
1,555
L CrustuHns,
llolluscH,Chilld
Frozen,S1lttd tlc !Xgl
Austnliil
C1n1d1
Hon9 Kong
United Shtn
Soloen hhnds
China - hiwin
Japan
Sing1part
8,829
" 129,811
81105
1,400
90,594
23
300
136,356
m
324
24,756
26,019
70,128
m,m479
22,300
2,600
286,892
50
2,484
I fh• llul Fit far llullft
ConsHptiOII
(Kgl
lu1tnll1
YHHh
HongK1111
300
3,150
306
720
298
ll,329
Totil
904
15,1'9
£ ltche-ft•Mr
(Ktl
Ru,trllh
llttl Zealand
Canida
Kong Kong
United States
China • hiwan
J1p1n
Singapore
12,399
1,806
5,243
438,932
3,073
167,095
200
u,m
60,192
,,on
31,259
1,471,854
27,774
589,978
520
42,186
Total
640,392 2,233,562
F Fish,Dritd,Salttd IXgl
or in Brine
United ShtH
Au1tr1lh
tan1d1
H011g Xon9
lit• ZHlllld
Chin1 • hiHa
m
11,691
433
18,6'0
1
5,000
3,276
32,947
3,123
93,597
l
20,m
--------T-o--hl
& P11rl shells
IKgl
Hon9 ion;
hp1n
Chinil - TiiHn
Korea Rep. of
Tohhu lshn~s
________l_o_h_l....
J6,2-0-9-··----1-5-3-,6-6-9-
1,000 ,,,e,
19,603 128,768
1,000
5,272
1,000
5,844
5110
2,163
·----------------·
23,193 147,036
M Troch~s shells
IKgl
Hol1g Kong
77,629 m,soo
Japan
165,064 m,m
Koret Rtp, of
7,120
31,267
--------T--o-h-h--u--l-sh..-n-ds
63G
1,567
-----------T--o-ll·!---------------------2-5-0-,-4-4-3-------9-9-6-,7-7-9--
Tvrtlt sheIIs
!Kgl
Fnntf
70 ,,11,
Japn
1,688 102,777
----·-...--T-a-h--it-i------------------------------2-~-0---------1--,0-2-0--
------------T-o-h--I------------. -----------2-,0-0-B--------1-1-2-,9-1--6-
Tohl
239,1'56 857,285
" Dlhtr Preputd or
Pnsen~,fish
Canned, etc
IXgl
Japan
61
1H
intern 51101
Aullr11ia
Canada
888
2,825
ma,,,ms,
19,682
4,387,241
French Polynesia
10,188
2l,435
Kiribati
877
11680
hvdu
1,305
2,610
New Cihdonia
3,059
8,248
New Inland
,0,022 169,785
Niue
3,278
9,707
United Kingdot
3,876,510 16,094,756
Nauru
125
183
Tongi
4,928
12,m
China - Tiliwan
12,876
42,046
Cook lshnds
884
6,571
---------U-S-A--------..--.
55
147
--------T--o-h·l-----------------------4.,.7..6..7-,-9-7-0----20·.,.7...8_0_,_80_4__
N Dried Su Ntd
l~gl
lie• Zuhnd
--·------------
216,886_____.,m___,_a_n....
_________T_o_t.a...l.......-------
2a,BB6 136,872
a Warted Tortoist - shell and
articles of Tortoise - shell etc
including PHrls ind T/buUans
Japan
us~
China - hinn
Ne• Zuhnd
N,mitius
Yahl ....___________,,.____
213,850
22,929
B,309
36
2,900
--·-·-----
248,023
p Soked Fish
Australia
tanildil
,..,. _______lf_o_n_gK,. _on_g____________
JOO
3,1~0
2
13
10,94..,0_,..______4_1.,,1_5_7__
--------T-o-h--l ----·------------------1--1-,-m·---·-·--4-4-,-3-2-0-
a Caviar I C1viar substitutu,Fhh arinides
Sausilges etc
austrillii
75
m
--------...--------------------------···--------··---------
---------T-o·-h-I----------------
75___ ,.._________m.,. __
31

4.6 Page 36

▲back to top
TABLE 14
RE - EXPORTS : 19B7
-------------- 1st Ouarter
2nd Ouarter
3rd Ouarter
4th Quarter
Total
-----========================================================================================================================:======
Ouantity Value Quantity Value Quantity Value Quantity Value Ouantity Value
----=:====================~==================~=========~;=======================================:========~-~===============:==~=====
A Fish Frozen , Fresh, or Chilled (Kgl
{including Fillets)
Australia
Uniled States
500 1925
0
(1
0
0
0
0
500 1925
6346 19038 3300 9900 1296 12086 454967 1527086 465909 mmo
Japan
0
0
0
0
0
0 110700 75000 110780 75000
Puerto Rico
0
0
0
0
0
0 449606 1362B30 449606 1362830
Aircraft l Ships stores
0
0
0
0
0
0 35000 5805B 35000 58058
Total
6846 20963 3300 9900 1296 12086 1050353 3023774 1061795 3066723
B Fish dried Salted or in Brine
Hong Kong
1Kg)
542 9749
0
0
0
0
0
0
542 9749
-----------------------------------------------------------------------------------------------------------------------------
Total
542 9749
0
0
0
0
0
0
542 9749
C Other Prepared or Preserved Fish,
Canned etc,
(Kg)
Kiribati
Nauru
United Kin
Chill!
408 490
0
0
0
0
0
0
408
490
0
0
0
0 97 543
0
0
97
m
0
0
0
0 13152 54B01
0
0 13152 mot
0
0
0
0
0
0 16000 2023B 16000 20238
Total
40B 490
0
0 13249 553J4 16000 2023B 29657 76072
D Worked Tortoise - shell and
articIes of Tortoise - she11 etc, (Kg J
Vanuatu
Tahiti
NeN Caledonia
Cook Islands
Aerican Saoa
430
0
0
2540
0
0
0
760
0
0
0
412
0
0
0
Total
2970
760
412
E Oth~r (Inc.corals etc)
Japan
0
130
0
0
430
0
2540
0
760
0
412
622
622
622
4764
0
m
Total
F fish Pastes
Australia
Total
0
130
0
0
0
0
0
0
130
0
240
350
240
350
0
240
350
240
350
t All the products 1entioned above were i1ported
3z
and re-exported without any changes to the ites.

4.7 Page 37

▲back to top
INPDRTS tm
TABLE 15
...............;,.-......:i:.======"=··•·-===============::,:;::;:;::::::c::s-s'll:,;;sl'-s::::::::::::,--:::::::::::::::::::::::ra:•:-:::1:::::::as
lln D•miption
Unit Yolut
Vilut
lbu,,rriplion
Unit Yalu•• Value
------:::.:::: ..: :..:::..1:........... :::~,;:::====::;-::::::::::::::::::::::::::::::::::::::::::::::::::.:::::::::=::::a:s::r:::::11::::====•=
Fish, Livt
[Nol
- -·----A--u--s-t-r-il-h-------.................______5_0_0_______.,__m_____r
·----------------~ ........____T__o_h__I________________________5_00
172
B. Fish, Fresh or Chilhd (Kgl
Australia
3~50
mz
Kt• luhnd
411067 472838
China • hiun
17760
~05~
,m Tra•hrs·Chini (Taiwanl
25071
Aircraft and Shi,, ,torn
um
SG71
USA
~444128 414888
Wnhrn Sana:
zuo
2484
---·····..·--------------------------..--....-......-.......-•-•:
-----........T..o.-t.a.-l ----·-·---·-----------------------------:
C Fish,Froun,lncl Fillets,Fruh,
Chilled or Froieo
[Kgl
Australia
China- TaiNan
2me
28617
m2m 5114083
Hrihali
9304BB 934094
J,pan
Mu luland
1&20382
mm
2509&93
190816
Tra-.lers-Chi1u1 llaiw•tt,
US A
Solo1an Islands
Tahiti
97270
257880
1mm
msn
1591'8
229599
1331017
552146
Aircra1t I ships slon
372
1488
Trawltrs • Y.oru
4020
2412
Koru Du. P Rrp, of
1921&2 ma,9
Portugd
mm 397974
-------W--e-s-t-e-rn--S--a-o-o-..··----....................4.5..4..0........---1-7-2-4---:
----------T--o-t-a-l------------..............1....m....m............1..2.0..5..0..0.7_9___:
D S1ohd Fish
(Kg)
Oth,r (Inc. pearl I turtlt and
lrothus sh,lls ,torals etc. I
India
BB
Australia
5&4
H•• !ul,nd
m
Phil I i pines
1m
lohl
zm
Crushcu~s ,nd Molluscs,
ChiII,d,Fronn,SII lfd,tlc (K9l
Australia
12m
N•• z,.tud
8519
CMn,- hop1~• J hpultlic Of 176
J1pan
91
Koru, Rep. of
40
China • hiwan
398
Hong Kong
m
S•ilzerland
l
YielnaP Rep. of
200
India
&00
USA
sm
14mo
31986
mo
1m
1549
70'9
4077
10
2083
2817
BBOO
Tol,I
28387 203018
Caviar and Caviar Substitutes
Fish·ftarinadu, s..sages [Kg)
Australia
110
801
,U,,S,nA
980 10'4
9
1'9
Canada
24
212
Ne• Zealand
270
690
Tohl
1393 zm
New leahnd
1
37 K Fish P..t..
Australia
m
11094
USA
__ ···---··--·---..-.._.._.._______....______________..______.. .._:
Japan
C1n1da
-.............T..o.t.a.l...........___.._..-....-----·-----m---------.1.-11-3-1---:
Tohl
Fish,Oritd,Salled,or In 8ri•• (
(KgJ
13
29
J8200
38242
J6
m
76431
)6720
Chiu· Peoplr's !epublk Of 149
Hong Kong
758
Aircraft ••d Sbi1s ,tores
m
Japan
18
A,erican S111J-1
mo
m1
L Prepared or Preserved
2747 Crustaceans and Kollusts • Other
2068
"d•y•i•
(kq) 338 Jm
1226
Australia
34~8 23007
2810
J,pan
141
S79
lra"1•rs Chin, (hiwant
3160
12640
Hu Ze,hnd
220
S73
..--·----~-e-s-h--rn---S-a--o-l-..--..-....--..............2..7.2..0...________&.6._8_0___: -..·-----r.-o-r-ea--R--e-p-.-o--f·-----·..··..·--·-----1-4·---··--·-1·4·8··
_ .._.._..______T_o_h_.l..............................___........9.7..B..2. ..____3_·0·15-2·••: ..........T.o..ta..l...--------·............................U...H...---....-m-.o...o...
r Cruslac•ans an1 Noll1Scs Livt (
N Crustaceans
Ntw Zealnd
32S7
(Kgl
- - - · - - · · - · - · -..- ....- - - - - - - - - - - - - - - - -.....................................__ l
Aostralh
51
102
--------- Total
--------·----------..
m
3257
N, I ay,ia
m ms
..--..----------..·-•-: ............................................_...........___....................____
Olhtr Prepared or Prtstrved
Tola!
2947
Fish, Cannad etc
1kg)
Austnlh
Sbl66
70835 H Vor~ed Tortoise shPII ,nd
Canad,
111m
thha· People's Republic Of 802
Chile
mm
255503
ms
mm
orliclt• of Torloi'" shtll etc,
Australia
1Sl1
Kong Kong
KorH I REP.of
Japan
b• !rahnd
1696
229603
1831071
482B
5316
mm
mmz
171i6B
China · hi•••
Hong kong
India
Hnited kingdoo
10m
mu
30
m
China hiwan
75
213
Ptru
50
Peru
2783'
36959
Ne• Zealand
13818
Y.oroa D••· P R•P· of
29795 Jme
Phillipim
58088
Unibd Shies
m
2310
Uni!Pd Shies
~692
lr,land
21B31
28512
China P Rtp, of
300
---..--..-T.h..a-i-la-n-d------.._.._---------.......-4--8-96-9--------6-10-8-2----:
_.._....._.. ____T__o_l_d_..___ .........___ _.,____ _2_5..6..1_.9_3_1__....._..3_6..5__0.0...!.8_.._.:
Tu.alu
828
.........·S·i-n-g-ap--o-r-e-..---------..___-----·---------..-m--·--
Total
Ydut
Fish IHI flt for
bu11n consu1plilln
Australia
Jip,n
Ne• !eahnd
Parlugd
..------1..1-e-s-t-tr·n S110•
lohl
)2
90
II m
121
1237
28
63A
.......____2_60,...._____1_0_4_0_..
m 3215