FFD_AR_2003

1 Pages 1-10

▲back to top

1.1 Page 1

▲back to top

1.2 Page 2

▲back to top
~
I
I
\\I
11\\
1.0
I.l
I. I .1
1.2
1.2.1
1.3
1.4
2.0
2.1
2.2
2.3
2.3.1
-..,
..,)
J
.-
2 ..),,'\\
2.3.4
2.3.5
2 ..H l
.., , "1
~--'. j
2.4
2.4.1
2.4.2
2.4.3
2.5
2.5.1
2.., .
5
"
_.)
.2
,
..)
2.5.4
~.5.)
25.()
2.5.7
2.5.8
2.:'.9
2.6
2.(1. I
2.6.2
2.6.3
3.0
\\'ision
.1
\\Iission
.I
Roles and Responsibility
.I
Fiji's Fish Resources
.. 1
'l'he Fisheries lndustr~'
.. 2
(Jffshore Fishery
.. 2
L:\\port Earnings
.
2
Inshore Fishery
E:\\port Earnings
Imports
.2
. -..,
.. 2
Subsistence Fishery
.3
Departments Activities
.. 3
Activity I: /\\dministration & Policy
.3
Activity 2: Training & Education
.3
Activity 3: Research
.5
\\clarine Resource Inventory
..
5
Pearl Oyster Project .
.............................................. 5
Giant ('Iam Project
.
5
Turtlc Research
.. 5
Fiji Locally Managed Marine Areas (FLMMA) Network .. 5
Emironl11ental Impact Assessment
.5
Collaborative Research
..
5
Activity 4: Management and Tecbnical Serviees
.6
Management 0 f 0 tTshore Fisheries (I'LlI1a)
..
6
Management of Inshore Fisheries .
7
Technical Sen ices
..
9
Activity 5: Capture Dcnlopment and Extcnsion
.. 9
Beche-de-mer'Troehus Women in Fisheries ......
9
Aquarium
.
10
Live Reefhlod Fish (LFRR)
. 10
Product Development.
.
10
Small Scale Tuna Development FAD.............
.. 10
Deepwater Snapper
Rural Fisheries Sen icc Center
. 11
.
II
Coasta \\ Fisheries Development..
EXlL'nsion
.
11
. II
Activity 6: Aq uaculture Dcnlopmcnt
Freshwater Aq uacul ture
Hrackish Water Development.
\\briculturc (Seaweed)
Information and Library Sen ices.
Appendi:\\ 1... .
...........................................
Appendix II .
A.ppend ix Ill.
.
Appendi:\\ IV
..
. 11
.. II
.. 12
. 12
.. 12
I.')
24
26
2R
TABLES
lahle 1:
r~lble 2:
Table :;:
"able 4:
Table 5:
Table 6:
Table 7:
Table X:
Table 9:
Table 10:
Table I I:
Table 12:
Table 13:
Table 14:
Table 15:
FIGLRES
Figure I:
Figure 2:
Figlll'c :;:
0\\ erse~b Trainttlg in 200:; ..
........ ....... 4
Local Training In 2003
.
4
Collaboratl\\ e Research.
6
The number DC Domc,tic \\ esseb licensed hl fish in Fi.ii~lJl
\\\\ater-
..
(,
Tun~l Cltch Cor 20()3
..
............... 7
Obsen er COl erage Cor licensed \\csseb in 2003.... .
.. "1
Fish sales in the Western Di\\ ision in 2003
..
Fish Sales in the Central Di\\ ision in 2003
Fish Sales in the Northern Di,ision in 2()()J
..
.x
20()~ Total Fish sales in all Divisions
X
Number 01' Licenses per prO\\ ince. ethnic breakdown and
number or ere\\\\ by division
.8
Number and Type llfvessels used in Inshore Fishing
1\\
RDM hports in 2003
9
Trochus E:'lports in 200:;
9
E:\\port of aquariulll cOllllllodities in 2003
"
10
,
Export of Fisheries COlllnwdilies in 2003
.. .)
2003 Catch Rates of tlle Licensed Longline Fleet..
4
Sale (MT) oC Finfish and Non-tinfish Crom 1992-2003
1\\

1.3 Page 3

▲back to top
I. Vision andMission
DEPARTMENT OF FISHERIES has a VI[SlrON to have Fisheries become and continue as one of the leading sectors in Fiji's socio-economic
development and growth and ensure that the resource owners are adequately and equitably remunerated. The Departments MJ[§§XON is Sustainable
developmentand management offish resources through strengthening research capacity, extension, resource management and conservation.
II. Roles and Responsibilities
The Fisheries Department has a clear mandate to sustainably manage the country's fisheries and marine resources as a whole. The Department assumes
an advisory role to the customary fishing rights owners and is responsible for instituting legislative and enforcement measures and developing specific
commodities for commercial viability. The Department issues and regulates licenses to fish in customary fishing areas upon prior approval of the head of
the designated ownership unit. Necessary amendments in fisheries legislations and their enforcements enable the division in the exploitation and
conservative management of resources.
The offshore EEZ and terrestrial sea resources are a major responsibility of the Department in terms of management, monitoring and evaluation of Tuna
resources.
III. FIJI'S FISHERIES RESOURCES
Fiji has a land territory of 18,272 square kilometres or 11,420 square
nautical miles. It has extended its sovereignty over 130,450 square
kilometres or 70,440 square nautical miles of Archipelagic waters and
45,000 square kilometres or 24,298 square nautical miles of territorial
waters. In addition, Fiji has acquired "sovereign rights" over the resources
in the 200 nautical miles Exclusive Economic Zone beyond archipelagic
baselines in an area totalling 1,145,000 square kilometres or 715,625
square nautical miles.
Fiji's Economic Exclusive Zones (EEZ/ of 1,450,000 million square miles
and Territorial waters of 24,298 square nautical miles are rich in
commercial fish species especially the highly migratory tuna species of
Yellow fin, Skipjack, Albacore and Big eye. The total allowable catch for
tuna longline in Fiji is 16,000 metric tons. There are also non-tuna species,
namely: marlin, sailfish, mahimahi, barracuda, and opah. The reef slopes
and seamounts are populated with Deep Water Snappers. The
Archipelagic and Inshore waters of Fiji are the bases of the Inshore
Fisheries. It is rich in marine life and very diverse. There are 41 0 registered
"Ooliqolis" or customary fishing right areas throughout Fiji, which
support the Inshore Fisheries. The qoliqoli are customary and communally
owned by indigenous Fijians.

1.4 Page 4

▲back to top

1.5 Page 5

▲back to top

1.6 Page 6

▲back to top
Table 1: Overseas Training in 20
Nallle
Apolosi Turaganivalu
Alifereti Qauqau
Shital Swarup
Sunia Waqainabete
Alice Leewai
Vasiti Vuiyasawa
Louise Isimeli
Nemani Cavuilati
John Amoe
Apolosi Turaganivalu & John Amoe
Eloni Tal?ali
Aisal?e Batibasaga
Gerald Billings
George Madden & Jone Vasuca
Suresh Chand & Aminio Raimuria
Mere Siqila
Leadership Training and Fisheries Management and Conservation
Introduction Course on Bral?ishwater Aquaculture
Global Biodiversity
Fish Quality
Marine Environment Conservation for APEC Countries
Regional Worl?shop on Verification & Auditing of HACCP Systems in the Fishery
Coastal Fisheries Extension Course
Data Analysis Training
16'h Meeting of the standing Committee on Tuna and Billfish
Coastal Fisheries Management
2na Meeting on Aquaculture Production
Distribution of Fishery Products
Technology & Management of Aquaculture
Management of Tropical & Sub-Tropical Fisheries
Seminar on Development of Sustainable Commercial Aquaculture
Japan
Malaysia
India
Thailand
Korea
Malaysia
Japan
Noumea
Australia
Japan
Norway
Japan
Taiwan
Taiwan
India
'pons.r
FFA
OFCF
MTCP
UNDP
FAO
KOICA
FAO Inforfish
OFCF
SPC
FFA
)lCA
FAO
)lCA
ICDF
ICDF
APO
12/5-20/11
14/06-26/07
15-18/06
16-20/06
13/06-13/07
7-11/07
8/07-18/09
1-6/07
9-16/07
17/7-24/08
7-11/08
18/8-31/10
26/08-12/09
5-18/09
15-20/09
in
Nallle
Apolosi Turaganivalu
Anare Raiwalui
Shital Swarup. Mere Siqila, Sepi H
John Ah Tong, Javil?a Ambaram, Alice Leewai
Vuli T, Kolinio R, George M, Lesi N, Mail?a T, C. Tomasi, Tel?ata T. Filipe V
Tulia K, Tupou V, Vilisi N, Sangeeta S, Laisa V
Margaret T, Mere S, Vasiti V, Warsha S, Sam M, Sunia W, Semisi N. William S,
Anare R, Sil?eli V, Ram L. Aisal?e B, M Tuiloa, John Ah T, Apolosi T, Eroni T,
Mere T, Sepi H. Shital S, Lepani D, Apisai S
Sea Coast Worl?shop
Prawn Rearing Macrobrachium
Rosenbergii
Seafood Inspectors Certification
Basic Management Course
Introduction Course
Sl?iIIs Training for Middle Managers in
Project Design and Documentation
Fiji Islands
USP
NRS
USP
CTD - Nasese
CTD - Nasese
Colo-i-suva
USP
C-SPOD
FAO
PSC
PSC
AUSAID
9-13/03
3-31/03
22/04-09/05
11-15/08
25-29/08
1-12/09

1.7 Page 7

▲back to top
2.3 ACTIVITY 3 RESEARCH
The overall objective ~~,,~,tt~sectionis to better understand the stocl? status and species
composition for the 11\\~~~~filfi~~~ources;to conduct studies on culture of new species;
undertal?e research onieanl1gand reef reseeding technology for Ciant Clam Species;
continue resea~~bll~!~h~Jnursingpearl oyster for seeding, rearing and spats collection.
This activity h~lt~.s"componentsas outlined below.
2.3.1 marine resource inventory
2.3.1.1 objective
Undertal?e resource assessment survey for the 410 Customary fishing right areas
"qoliqoli's" within Fiji's Inshore fisheries sector.
2.3.1.2 currentstatus
The "resource inventory team" managed to survey five (5) "qoliqoli's": Til?ina Comla,
Serua Island, Navutulevu, Korolevu+wai &Kiuva.
Compiled Resource Profiles for 1"Qoliqolis": Til?ina COflua.
The compilation of each 'Marine Resource Inventory' for the five completed surv~y
currently underway. Once the 'Marine Resource Jnventory' is compiled, a
management plan will be documented for each "qoliqoli" in consultation with the
resource owners, and this worl? Will proceed as part of ourobjective for 2004.
Five "Qoliqolis" were surveyed in collaboration with Secretariat of the Pacific
Community (SPC) and these are Vavusa Naval?avu, Til?ina Lal?eba,. Dromuna,
,yavusa Mali & Til?ina Namul?a (Vanua Levu). The resource profiles for these
"qoliqolis" has been completed and submitted by SPC.
2.3.2 pearl oysterprl~iect
2.3.2.1 objective
Undertal?e research in the nursing techniques of blacl?lip pearl
margiferata '.
'Pinefada
2.3.2.2 currentstatus
'ltherlel Pilot, ......
Collected 8,500 spats and seeded
4,500 shells.
2000 pearls were harvested of a value
of US $25,000-00;
Pearl Shell is used as a by-product for
Ornamentals.
Pr.v.te'ector Development
Harvested 27,000 pearls.
Seeded stocl? - 50,000 till August 2003.
Ind.genou. F.rmer
Ratu Jone Maivalili seeded 3,000 shells and produced 700 pearls.
2.3.3 giant clam project
2.3.3.1 objective
Undertal?e research into ocean phase rearing
reseeding purpose.
2.3.3.2 current status
Production of 10,000 spats. .
Research rearing of 1,100 juvenile eli
Reseeded 7 reef sites inp(Jrtnership wi
NaiQani. MaIolo. Ver~ruet""ot
2.3.4
nesting
'C/uj,[onia
2.3.5 fiji locally managed marine areas (FLMMA) network
2.3.5.1 objective
Unde~~~~:d~,~nservation collaborative research with othel':n~r-gOVi
orgal'l1i~1~' e.g. International Marinelife Alliance (IMA), Worldwide
Nature (~F), SPC, South Pacific Regional Environment ProQramme
Department of Environment
2.3.5.2 current statu.'!
Established 3 Marine Protected Areas (MPA) sites at Til?ifla.NavoROvu
Til?ina Korolevu+wai (Nadroga) and Til?ina Vanuaso (Cau).
2.3.6 environmental impact assessment
2.3.6.1 objective
Undertal?e fisheries environment impact assessment for sites identified for
development.
2.3.6.2 current status
4 Fisheries environment impact assessment studies were undertal?en.
2.3. 7 collaborative research
The research team was also involved in collaborative worl? with other regional and
overseas institutions with regards to marine issues in Fiji. The details are outlined in
the table 3 below.

1.8 Page 8

▲back to top
1.4 ACTIVITY 4 - MANAGEMENT AND TECHNICAL SERVICES
1.4.1 MANAGEMENT OF OFFSHORE FISHERIES (TUNA)
1.4.1. / TUlia Fishel],
Tuna thrive in arem of high planRtonicconcentrations since they prey on the
small planRtivorous fish. In Fiji, catches of tuna vary seasonally due to the
changes in Sea Surface Temperature throughout the year (Langley. A. 2003).
The species composition of the tuna catch is primarily made up of Albacore
(typically more than 75%). followed by Vellowfin. then Bigeye. Seasonally. the
second and third quarters (April-September) account for the highest catches of
tuna by the Fijian long line fleet. The seasonal catch for Albacore are usually
highest in the third quarter and lowest in the first. whereas the highest Vellow­
fin and Bigeye catches are typically during the second quarter (corresponding
to the period with the highest sea surface temperature) and lowest during the
fourth quarter.
Long lining has been the predominant fishing method in tuna fishery over the
Imt decade. Catch log sheets are completed by vessels and provided to the Fiji
Fisheries Department as an obligation of their license. 2003 recorded 101 li­
censed vessels. Table 4 shows the breaRdown of domestic vessels licensed to fish
in Fiji waters over the last five years.
0' Tallie 4, The nillftile. dOlftestlc ve..els licensed to .Ish In FIJian
Wate.s.
YEARS DOMESTIC LONG LINE DOMESTIC POLE AND LINE
VESSELS
VESSELS
1999
43
I
2000
61
1
2001
96
3
2002
103
2
2003
101
I
The number of active vessels fishing inside and outside Fiji waters at anyone
time remained at around 80% (same for 2002) with the highest recorded for
the month of August. These vessels averaged approximately 158 fishing trips
per month with the highest number (181 trips) recorded for the month of May.
The annual catch volume achieved by the 101 licensed longline vessels for
2003 totaled 10,&0&.10 NT of both tuna target species and pelagic fish spe­
cies msociated with tuna - termed as by-catch. Out of the 10.606.10 MT.
&4qo (6.799.60 MD wm caught from within Fiji's EEZ with the remaining se~o
(3.806.50 MD caught in adjacent EEZs and in high-sea pocRets. Table 5 de­
lineates the details of the catch by species.
Page 6 of 28

1.9 Page 9

▲back to top
Table 5, Tuna Catch to. ZOOI.
Specl.,
In,Id. EEl O..tsld. EEl
Albacore
Bigeye
Yellowfin
By-catch
Total
3.823.3
434.50
1,356.00
1.185.80
6,799.60
2,340.08
329.10
87250
561.40
3,806.50
Total
6613.38
763.60
2228.50
1747.20
10606.10
0,0 Catch
I
~
62.35
6.94
21.01
16.47
Records show that the catch of the
national licensed fleet in waters
outside the EEZ has increased sig­
nificantly over the last three years.
In 2001 the outside catch of all spe­
cies was 10%, 26% in 2002 and 36%
for 2003. As of 2001, the effort in
waters to the east of the Lau
Group has increased immensely.
Trends in distribution of effort over
the last three years have seen a
movement of effort from the west
of Viti-Levu to these waters.
~e2:
'.1i lf
I
~
AF
~ 1("
DO
!~l oe
2003 Collen Rates 01 Ire lJoonsed Lorg",'le Reel
. .... ,
...... - ~
.- .." .
. •• ~
... ,.'
... ~ o~
.' -.'
6
!!!
6
a. (12
<.>
O.D
-Q... .. ------- • -...,; n
J ~!J~~g
p
!
~
i
I
M'''Oh
Albacore catch was highest during the month of July and the lowest in April
2003.The 2003 pea~s and troughs in albacore catch, although lower than 2002,
ore still distinctive and thus reaffirming that the 2003 fishing period ore highly in­
fluenced by the seasonal patterns. Bigeye and Yellowfin catch show similar trends
with the troughs in September and the pea~s in May and June respectively.
Trends in nominal Catch Per Unit Effort (CPUE) ore sometimes used as an indicator
of abundance, but must be considered in association with other direct (e.g. target­
ing strategy, patterns of effort, size composition of the catch, recruitment etc.) and
indirect (e.g. environmental) factors affecting the fishery. Figure 2 shows the 2003
trends in tuna CPUE for the Fijian longline fleet.
The export of tuna is outlined in the preceding section on Fishing Industry.
2.4. I. I Observer Coverage
Table 6, Obse.ve. cove.age to. licensed vessels In ZOOI.
Quarter 1
Quarter 2
Quarter 3
Quarter 4
Port Samplinq Transshipment Observer Placements
336
64
11
346
22
72
25
6
2.5
24
2
There was a significant
drop in the vessels
coming to the port
from the 3rd quarter
due to the EI-Nino Ef­
fect.
-
• p.
2.4.2 ~[ANAGEMENTOF INSHORE FISHERIES
2.4.2.1 objective
Establish the inshore fisheries management information/statistics system.
Underta~e data collection and analysis.
2.4.2.2 ('urrellt status
Access MIS Database established for inshore artisanal fishery.
Underta~ing ongoing survey on catch data and fish sales in municipal mar~ets
and non-mar~et outlets.
Participated in public exhibitions and school fisheries resource educational aware­
ness programmes.
A.thanal catch data
Til.: artisanal fishery contributed 6664.9 MT of seafood to the domestic mor~et. The
artisanal fishery is managed through the issuance of Inside Demarcated Area li­
censes and Outside Demarcated Area licenses. Tables 11 & 12 delineate the inshore
licenses issued by the department and the number of vessels in operation in 2003.
The inshore finfish and non-finfish catch according to the different boundaries is
outlined in Tables 7 -10.
Table 7, Fish .ale. In the weste.n division in ZOOI
We,t
-
I
MUnlcipal Mar-
bet
Non Municipal
Marf>et
Total
Fin Fish
Volume
(MT)
436.9
Value (5)
1974953
Non Fin Fish
Volume
(MT)
I
557.*
Value
($)
664740
Total
Volume I
(Mn
Value
(S)
994.30
2639693
134.7 I 547089 I
37.6
\\95000 I 172.30
742089
571.6
2522042
595
859740
1166.6
3381782
Table Sa Flth 1..les In the central division In ZOOI.
Central -
Municipal
Marf>et
Non Municipal
Marbet
Total
Fin Fish
Volume
(MD
250
Value
($)
111312/3
Non Fin Fish
Volume
(M\\)
646.3
Total
Value
Volutlle I Value
($)
(MD
(S)
I
2747221
896.3
3860449
1860.2 I 82m6B I
7937
3373399
2653.9
11650767 I
2110.2
9390596
1440
6120620
3550.2
15511216

1.10 Page 10

▲back to top
Northern
'I FIn Fish
-
Volume
(MTl
lL1111r..Ipal
4arket
5243
NOll Municipal
flAarket
Total
Value
S)
2096950 1
126,6
703
196.9
,U'·
Western
Volume
(Mr)
I Value (S)
9943 2639693
Central
Volume
(Mf)
896.3
Value ($)
3860449
, Value (Si VVI\\,.lllt'l:;;;
(MT)
6509 30n376
166.1
965271 2653.9 11650767 1303.4 5712890
600011
5000
f=' 4000
~
~ 3000
<:
::>
">0 200
1000
a
, , , , , , & & ~~
~~
~~
~~
~~
~~ ~~~
~
~
~ ~ ~
~
~
Year
Total
PrOVince
IIDA(#1 ODA(#)
0
-
4.6 I
22
-
Namosi
10
-
Serua
19
Total
187
Sa
Lauloka
8a
I
Tavua
Nadl
Rakirakl
Nadrogal Navosa
308
11
I
65
47
34
51
20
-
I
11
Tala I
328
11 I
MaQJata
122
11
Cakoudmve
69
48
Sua
11
1
Tolal
202
60
Kadavu
Lau
3
51
I
20
11
LOITl8lVll!
22
0
Roluma
Total
I
0
0
45 , 62 I
FIJ!an
55
29
7
7
11
109
71
86
'0
167
54
31
15
I]
100
Indian Others I
31
-'l
Hi
1
15
3
-.
I
1
72 I 6
I
I
53
9
18
13
I
2
0
73
22
0
0
0
0
7
0
D
0
7
0
TotaJ I Total O'ew (#)
90
239
46
126
22
68
10 I
26
19
58
187
517
730
294
131
I
117
81
107
64
794
133
31')
117
202
12
43
262
56...
54
119
31
70
22
73
0
107

2 Pages 11-20

▲back to top

2.1 Page 11

▲back to top
2.4.3 TECHNICAL SERVICES
The Technical services comprises of 3 sections:
Fleet Maintenance of 12 vessel fisheries fleet.
Refrigeration Maintenance of 15 fisheries Ice Plants.
Engineering Automotive and electrical service support. Maintain 29 fisheries
government vehicle fleet.
2.4.3. 1 o~iecrive
Provide safe engineering and sea-going support.
Ensure maintenance of technical services stores and assets.
Undertabe preventative maintenance and small engine repair educational training
for fishermen.
2.4.3.2 current status
Full time engagement of technical service~ staff to extension capture program.
As~isted in the Installation of Rural Fisheries Service Centers at Wainiboro, Macuata
and Vanuabalavu, Lau.
Japan government provided bilateral aid assistance through Fisheries Oev.
Assistance for Pacific Is. Nations (FIOAPIN III) Project.
Preliminary Overseas' Fishery Corporation Foundation (OFCF) (Japan) study
identified priority on fisheries vessel repair and replacement of Labeba Ice Plant.
2.S ACTIVIT}' 5 CAPTURE DEVELOPMENT & EXTENSION
The overall objective of this activity i~ to provide Fisheries Management assistance to
Customary Fishing Rights Owners in the management of their "Ooliqolis"; to ensure
that fish resources are optimally utilised in a sustainable way; to provide vital
infrastructure to improve productivity and efficiency in the fishery; effective
participation and ownership of landowners in the industry; to ensure that an
effective two way flow of information is maintained for the efficient, productive and
sustainable development and management of the fisheries; effective monitoring
and facilitation of the development and management of specific high value inshore
fisheries commodities.
This activity has 8 bey components outlined as follows.
2. S. 1 beche-de-11Ier/trochus/wo11lell i/1 fisheries
2.5.1./ o~iecrive
Strengthen data collection in the 80M and Trochus Fishery.
Strengthen resource management guidelines.
A~~ist fishers and resource owners to sustainably manage their resources through
providing necessary information and training.
2.5.1.2 curre", status
Visits to the 80M and Trochus companies in the Western, Central and Northern to
strengthen data collection.
Participation in 280M Council meetings.
Outlined a list of guidelines that the companies need to abide to before entering
the Trochus industry.
A special resource tax has been implemented on the export of Trochus products.
These tax payments would go to fisheries and put aside for projects that would
be beneficial to the industry ~uch as research, education, law enforcement.
Implementation of a National 50% quota for the Trochus catch.
3 Women in Fisheries meetings and distribution of questionnaires to women fish­
ers in selected areas.
Conducted 1 Worbshop on 80M Cuidelines and Management.
Tables 13 & 14 delineate the 2003 export of 80M and trochus respectively.

2.2 Page 12

▲back to top
2.5.2 aquarium
2.5.2.1 objective
Strengthen data collection in the aquarium fishery.
Strengthen resource management guidelines.
Assist fishers and resource owners to sustainably manage their resources through
providing necessary information and training.
2.5.2.2 current status
Facilitated 6 Fiji Marine Aquarium Council Meetings.
Finalised aquarium trade policy gUidelines and currently awaiting approval.
Facilitated two custodian awareness worbshops for the Western and Central divisions.
Made a trip to Mabogai to inspect the site for feasibility study for a proposed
worbshop.
Visited aquarium commodity exporters to discuss ongoing issues.
Experienced a temporary CITES ban during 2003 which was lifted when the
endangered species protected Act regulations were gazetted.
Submission of export and re-export data from 2000 2002 to CITES by the
department.
The coral extraction and export in 2003 was within the defined quota as outlined in
Table15.
' ••Ie IS. Expo., of .......I..1n comlnodltles In 2001
COlnIllO..It"
Coral base rocb
Corals
Ornamental Fish
Ornamental Invertebrates
Giant clams - squamosa
Sand
Expo"
1127396 bg
154145 pes
182300 pes
35329 pes
419 pes
49280 bg
2.5.3 live reeffoodfish (LRFF)
2.5.3.1 objective
Strengthen data collection in the LRFF Trade.
Strengthen resource management guidelines.
Assist fishers and resource owners to sustainably manage their resources through
providing necessary information and training.
2.5.3.2 current status
Two companies are currently in operation and these are Atlas Ocean Products Ltd
and Satseas Company.
Fisheries observers accompanied Atlas Ocean Products Ltd. on 5 trips to Lou and 1
trip to Vanuabalavu in which the company purchased a total of 55.56 MT of fish
(live and dead) from the villagers.
Export of LRFF is mentioned in the preceding section on the Fishing Industry.
2.5.4 post harvest
2.5.4.1 objective
Undertabe marbet research and product development. Training quality control in
Hazard Analysis & Critical Control Point (HACCP) certification, product
development and downstream processing of low valued species.
Implementation of specific recommendations contained in the Fiji Tuna
Management and Development Plan.
Establish bi-lateraJ arrangements for fishing access with neighbouring countries.
2.5.4.2 current status
The project has been continuously worbing with the Industry throughout the
year in advising and assisting industries with their HACCP systems, explaining
the (USFDA) & (EU) policies, importance of meeting and complying with the US
& EU standard requirements, how to develop their FCx¥f and Safety Plan and the
importance of processing and exporting their fish and fishery products in hygiene
and satisfactory conditions using the HACCP principles.
Assistance was provided to 2 upcoming companies interested in commencing fish
exports.
Continued assistance was provided to relevant industry members in the prepa­
ration for impending EU mission.
Ongoing consultation and liaison with Ministry of Health regarding EU mission.
The Ministry of Health has been declared as the Competent Authority for fish &
fishery products.
*USFDA - US Food & Drug Agency *EU - European Union
2.5.5 small scale tuna development! FAD
2.5.5.1 objective
Provision of Financial Loan under 1/3 - 2/3 Subsidy Scheme for Small-scale tuna
longline fishery.
Provision of specific training on appropriate fishing in the small scale tuna fish­
ery.
2.5.5.2 current status
6 Sbipjacb fishers are effectively in operation currently.
31 identified small-scale tuna fishers were assisted through providing fishing
gears, safe affordable and recommended outboard engines and punts, under
the small-scale subsidy scheme of a total sum of $332,999.00.
Deployed 1 FAD at Oneata Lou, 1 at Liburi (Western Divisoion), 1 at Mau pas­
sage and 1 at Nasese.
Collection and assessment of FAD catch data, which recorded 27.75 MT of tuna
of a value of $59,414.50.
1 awareness training was conducted by the department in Vanuabalavu on
Gear Maintenance and Repair, Resource Utilisation, Post harvest and Basic Busi­
ness Management from 1't Dec to 5th Dec.

2.3 Page 13

▲back to top

2.4 Page 14

▲back to top
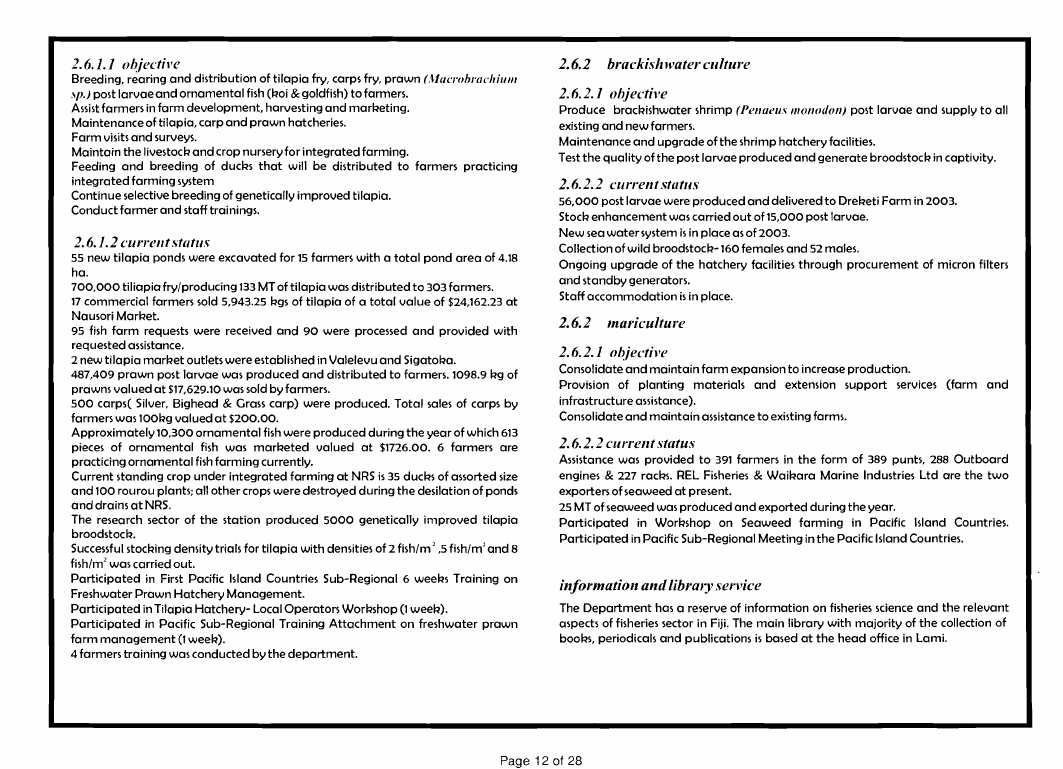
2. 6.1.1 o~iective
Breeding, rearing and distribution of tilapia fry, carps fry, prawn (Macrobracllilllll
.\\jJ.) post larvae and ornamental fish (Roi & goldfish) to farmers.
Assist farmers in farm development, harvesting and marReting.
Maintenance of tilapia, carp and prawn hatcheries.
Farm visits and surveys.
Maintain the livestocR and crop nursery for integrated farming.
Feeding and breeding of ducRs that will be distributed to farmers practicing
integrated farming system
Continue selective breeding of genetically improved tilapia.
Conduct farmer and staff trainings.
2.6.1.2 current statu.'!
55 new tilapia ponds were excavated for 15 farmers with a total pond area of 4.18
ha.
700,000 tiliapia fry/producing 133 MT of tilapia was distributed to 303 farmers.
17 commercial farmers sold 5,943.25 Rgs of tilapia of a total value of $24,162.23 at
Nausori MarRet.
95 fish farm requests were received and 90 were processed and provided with
requested assistance.
2 new tilapia marRet outlets were established in Valelevu and SigatoRa.
487,409 prawn post larvae was produced and distributed to farmers. 1098.9 Rg of
prawns valued at $17,629.10 was sold by farmers.
500 carps( Silver, Bighead & Grass carp) were produced. Total sales of carps by
farmers was 100Rg valued at $200.00.
Approximately 10,300 ornamental fish were produced during the year of which 613
pieces of ornamental fish was marReted valued at $1726.00. 6 farmers are
practicing ornamental fish farming currently.
Current standing crop under integrated farming at NRS is 35 ducRs of assorted size
and 100 rourou plants; all other crops were destroyed during the desilation of ponds
and drains at NRS.
The research sector of the station produced 5000 genetically improved tilapia
broodstocR.
Successful stocRing density trials for tilapia with densities of 2 fish/m 2,5 fish/m2and 8
fish/m2 was carried out.
Participated in First Pacific Island Countries Sub-Regional 6 weeRS Training on
Freshwater Prawn Hatchery Management.
Participated in Tilapia Hatchery- Local Operators WorRshop (1 weeR).
Participated in Pacific Sub-Regional Training Attachment on freshwater prawn
farm management (1 weeR).
4 farmers training was conducted by the department.
2.6.2 brackishwater culture
2.6.2.1 objective
Produce bracRishwater shrimp (Pellaells 1/101/0 dOli) post larvae and supply to all
existing and new farmers.
Maintenance and upgrade of the shrimp hatchery facilities.
Test the quality of the post larvae produced and generate broodstocR in captivity.
2.6.2.2 current statlls
56,000 post larvae were produced and delivered to DreReti Farm in 2003.
StOCR enhancement was carried out of 15,000 post larvae.
New sea water system is in place as of 2003.
Collection of wild broodstocR-160 females and 52 males.
Ongoing upgrade of the hatchery facilities through procurement of micron filters
and standby generators.
Staff accommodation is in place.
2.6.2 mariculture
2.6.2.1 o~iective
Consolidate and maintain farm expansion to increase production.
Provision of planting materials and extension support services
infrastructure assistance).
Consolidate and maintain assistance to existing farms.
(farm
and
2.6.2.2 current status
Assistance was provided to 391 farmers in the form of 389 punts, 288 Outboard
engines & 227 racRs. REL Fisheries & WaiRara Marine Industries Ltd are the two
exporters of seaweed at present.
25 MT of seaweed was produced and exported during the year.
Participated in WorRshop on Seaweed farming in Pacific Island Countries.
Participated in Pacific Sub-Regional Meeting in the Pacific Island Countries.
information and library service
The Department has a reserve of information on fisheries science and the relevant
aspects of fisheries sector in Fiji. The main library with majority of the collection of
bOORS, periodicals and publications is based at the head office in Lami.
Page 12 of 28

2.5 Page 15

▲back to top
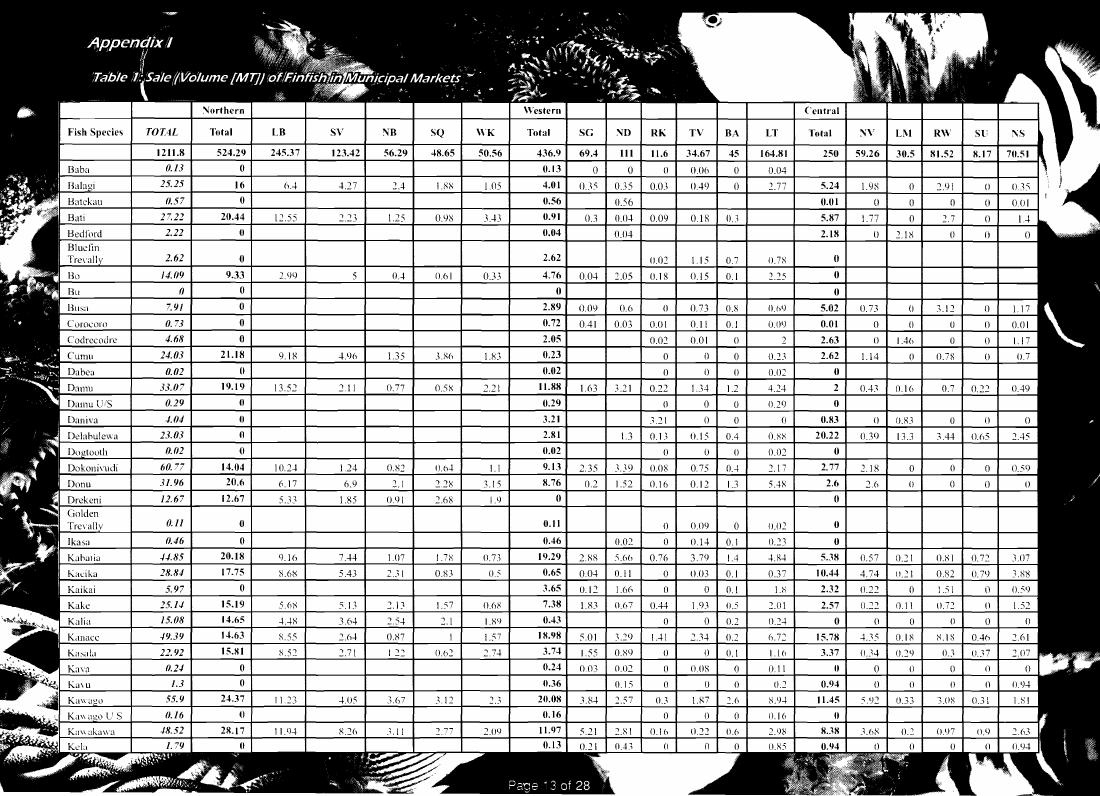
Fish Species
Coclrccodrc
s
Delabulcwa
Dogtooth
TOTAL
1211.8
0./3
25.25
1i.57
27.22
2.22
2.62
14.li9
o
7.91
0.73
4.68
24.03
0.02
33.li7
0.29
.JJ/4
23.03
1i.!/2
60.77
3/.96
/2.67
O.II
1i.46
-1-1.85
28.84
5.97
25./4
/5.08
49.39
22.92
Ii. 24
1.3
55.9
1i./6
48.52
Total
524.29
o
16
o
20.44
o
o
9.33
o
o
o
o
21.18
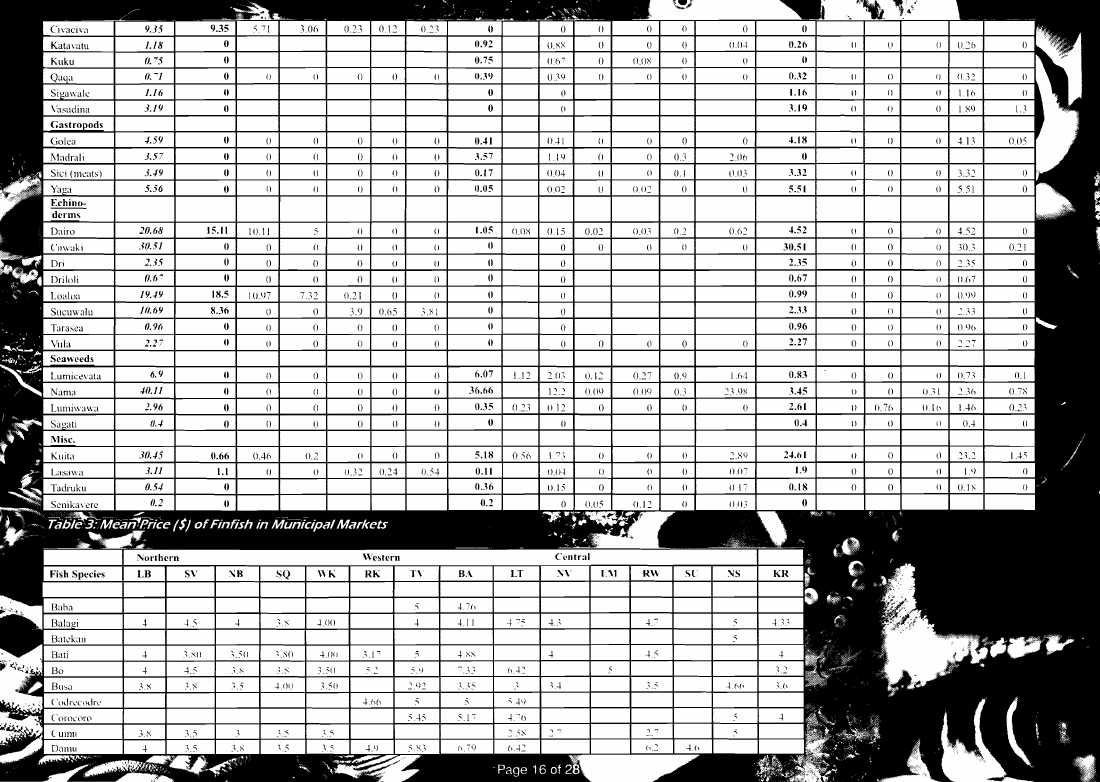
o
19.19
o
o
o
o
14.04
20.6
12.67
o
o
20.lll
17.75
o
15.19
14.65
14.63
15.111
o
o
24.37
()
211.17
LB
245.37
6.-1
12.55
2.99
9.18
13.52
10.2-1
6.17
5.33
9.16
8.68
5.6X
-1.-18
s.ss
X.52
11.23
11. 9-1
SV
123.42
"iB
56.29
-1.27
o~.0~J'
2A
1.25
0.-1
-1.%
1.35
2.11
0.77
1.24
0.82
6.9
2.1
I.S5
0.91
7.-14
1.07
5.43
2.31
5.13
2.13
3.6-1
25-1
2.6-1
0.S7
2.71
I 22
-1.05
3.67
S.2CJ
3.11
SQ
411.65
WK
50.56
I.SX
lOS
0.9X
3.-13
O.(ll
0.33
.l.X6
1.83
058
2.21
O.b-l
1.1
2.28
3.15
2.6S
1.9
1 7X
0.73
0.S3
0'
1.57
O.6S
2.1
1.89
1.57
0.62
2.7-1­
3.11
2.3
2. 7 7
2.09
Total
436.9
0.13
4.01
0.56
0.91
0.04
SG ;'liD
69.4 I III
oI 0
O..'~ I 0.35
0.56
0.3 I (J.(l-l
0.04
RK
11.6
o
0.03
TV BA
34.67 I 45
O.O(J I 0
0.49 I 0
0.09 0.18 I D.3
2.62
4.76
o
2.119
0.72
2.05
0.23
0.02
Il.llll
0.29
3.21
2.81
0.02
9.13
1l.76
o
0.02
0.0-1 I 2.05 I 0.1 S
0.09 I 0.6 I 0
OAI I 0.03 I Cl.OI
OJ)2
o
o
1.63 I 3.21 I 0.22
o
3.21
U I 0.13
o
2.35 I 3.39 I O.OS
0.2 I 1.52 I 0.16
1.15 I 0.7
0.15 I 0.1
0.73 I O.X
O.lt I 0.1
Cl.OI I 0
oI 0
DID
l.J4 I 1.2
oI 0
oI 0
0.15 I 0.4
oI 0
0.75 I 0.-1
0.12 I 1.3
0.11
0.46
19.29
0.65
3.65
7.38
0.43
Ill.98
3.74
0.24
0.36
20.011
0.16
11.97
0.13
o
0.02 I 0
2.8X I 5.6h I 0.76
00-1 I (UI I 0
0.12 I 1.66 I 0
I.S3 I 0.67 I OA4
o
~.Ol I 3.29 I 1.-11
1.55 I 0.89 I 0
0.03 I 0.02 I 0
0.15 I 0
3.S-I I 2.57 I (U
o
5.21 I 2.81 I O.lh
0.21 I O.-lJ I 0
0.09 I 0
(1.1-1 I 0.1
3.79 I 1.4
0.03 I 0.1
o I 0.1
1.93 I 0.5
o I 0.2
2.J-I I 0.2
o I 0.1
0.08 I 0
oI 0
1.87 I 2.6
oI 0
0.22 I 0.6
o
LT
IM.lll
0.04
2.77
O.7R
2.25
O.h9
o.w)
2
0.23
0.01
4.2-1
0.29
o
o.xx
0.02
2.17
5.48
0.02
0.23
-I.R-I
0.37
1.8
2.01
0.2-1
6.72
1.16
0.11
0.2
X.9-1
0.16
2.98
Total
;'Ii\\'
250 I 59.26
LM RW
30.5 I 1l1.52
Sl.:
1l.17
5.24 I 1. 9X
o I 2.91
o
0.01 I
0
oI 0
o
5.117 I 1.77
o I 2.7
o
2.lll I
0 2.1X I
()
o
o
o
o
5.02
0.01
2.63
2.62
o
2
o
0.83
20.22
o
2.77
2.6
o
0.73 I 0
OlD
D I IA6
1.14 I 0
OAJ I 0.](,
o I O.SJ
0.39 I 13.3
2.18 I 0
2.6 I 0
3.12 I 0
OlD
OlD
0.7S I 0
0.7 I 0.22
oI 0
JA4 I 0.65
oI 0
oI 0
o
o
5.38
10.44
2.32
2.57
o
0.57 I 0.21
4.74 I u.21
0.22 I 0
0.22 I 0.11
oI 0
4 ..'5 I 0.1 S
(U4 I 0.29
oI 0
oI 0
5.92 I 0.33
0.81 I 0.72
0.82 I 0.79
1.51 I 0
0.72 I 0
oI 0
8.IS I OAc>
O.J I 0.37
oI 0
() I ()
,.08 I 0.31
0.97 I U.9
Page' 3 of 28

2.6 Page 16

▲back to top

2.7 Page 17

▲back to top
\\'Of()l1iI110Ii
\\ 'lIll(lYUna
55.9"
1.39
2."8
fU4
1.6
II. -8
us-
2.22
n.54
11.115
~.85
25.65
o
n
o
(J
n
n
n
37.28
n
o
n
;-;.l)
12,62
'"1 1 '"'
',--)
~.K.2
~2~
2,~6
x, I h
;";,53
_Uh
~,II
(I
(I
11(13
1I
o
O.B
0.31
1.75
10.27
1.39
n.B
n.B
0.13
0.78
(J.B7
n.93
5.26
0.n5
0.21
n.81)
11,113 I 1,32 I ()
(I
(I,~S I (I(,~ I
(I
',x6 I 1.2X I (I~3
U(l3 I OAS I 001
lUll I IUlx I II
0,22 I (I
(1,(17 I Ij{, I (I
IL2 I (I
(11)7 I
I
(I
(I
O,XI I 2,23 I (LI')
o
(J,Oi
OJ)l I
I (I,Ox
0,05 I 0
(J I (J
(I I ILl
II I (1,1
lUI} I IU,
0,03 I 0 I
O,l~ I II
(H12 I (I
o I II
UI 0
(I I 0
(1,(15 I 0,2
0,02 I (I
o I (I
° 004 I
Ill7 I 01
° I (I
2.6
Ii, 1~
(1,51
~,IF
(I,"x
u
U,~2
1.1
(I,"
(1,(1,
on
1.lJS
OJI5
IL 11
(lAS
0, J
(I I
Ii
II I (I
II I (I
I)iX I
(I
135
20.02
n
2.34
n
0.47
o
1.05
1.29
o
o
2.64
135 I
(I
IU3 I }(l5
II I
(I
1~,37 I IIl,X
o I II
(I I 0
(I I
(I
II I
(I
(I I
n
° o I
(I I (I
(I I
(I
II I II
I) I
°IJ I
I
°°
0
J ",5 I II
l) I 0
TOHI
119U
Total
126.59
SQ
1,2.24
LB
33.11
S\\
1\\8 WK
15.89 6.48 8.87
Total
SG I '\\0 RK
557.4 52.7 I 85.2 14.7
TV
8A
24.94 103
2 JJd
53.93
II. -]
8 "7
-.55
3.35
]].28
18.6 ­
39.53
"8.8 7
11.118
In.55
2.2S
n
o
6,47
2.12
7,~
II
II
o
).7Q
(I
14.21
6.99
18.17
4.86
n
l)
") l ) '
1(1,0"
(I
u
II
(I
-x
2.~
(I, I' I 0.22
(I
(I,~ I I O,S,)
o
U I II
II
~.-+5
°
-+ ~ '"l
~,il)
(I
()
o I (I
I) I on
1,2b I (1(,
II Xl) I II
1.11 I 0,62
21" IOX2
2(,) I UIX
() I (I
°
i).l)5
(J
II
(I
1I,2h
II
0,2 ')
1)76
Ll7
(I
II
2, I.' I 11'(,
tu<~
II
(I,'~ I II,' J
(L2~
.)­
(I I (Il~
(I
0.8 IUI~ I 0, Oi,
II
2.18 (Ll6 I 0(,"
o
0.12
IU2
°
o
1.08
1.23
(I
o
Ul5
II
0,5
II
o
(I
o IH,
(J
o
(I
II
(I
I)
(I
(I
0.29
n.15
5.17
5.56
n.n8
Illq I II, J
IL I"
(lIS I 1.9X
IL I II I LX
(I
(I
II
()
(1(1'
(I
II 0,1
(I
(I
II
(I
Ii 09
(I
(I
461.4 ~~,2 I 51L~ 1,,­
22.51 I.XS I 1.111 (I,hl
0.59
n
(1,51
(I
o
-..._..... (X":\\
95
I~:'
~(l
(I
l),l
Page 15 of 28
LT
276.55
(J
11,71
o
o
IUIJ
()73
IU)h
(I
\\Ill
2(,1
I)I)S
.22-Ll)()
12.(-.'3
(I
Total
510.11
~V
UI
29.n7 22.4
RW SU
15.ll5 320
NS
123.9
10.28
495
0.6
8.77
o
o
J.S2
~,I S
o
2,~~
o
o
(I
L]:~
1)(,2 I 2,16
O,')~ I H4
(I I IU'
° I ~,53
1l.711
11.53
](>.1')
3!L45
o
o
II
~.q2
"~l)
(I
IA6
171
(1.21'
I,(I') I 5.42
1,2" I 5,57
OA" I 3,'):'
~h3 I 95~
Id
.~.5h
55~
2.5
~,~5 I 11]
I. ln I xl.2

2.8 Page 18

▲back to top

2.9 Page 19

▲back to top

2.10 Page 20

▲back to top

3 Pages 21-30

▲back to top

3.1 Page 21

▲back to top

3.2 Page 22

▲back to top

3.3 Page 23

▲back to top

3.4 Page 24

▲back to top
TOTAL
676.86
.B.75
101.76
o
o
6.88
18.33
18.67
2.09
o
o
o
o
1.12
29.34
33...19
o
o
o
418.03
1I.0.~
2.01
II
II
Total
70.28
o
22.61
o
o
o
o
18.33
o
o
o
o
o
o
o
29.34
o
o
o
o
o
o
o
II
o
LB
SV
NB
40.4 16.74 7.33
1-+.12
o
o
o
u
9.-+
o
o
o
o
o
I)
o
Ib.XX
U
(J
IJ
II
IJ
I!
IJ
o
5.53
o
o
u
u
~.92
o
o
o
o
o
I)
o
:".2Y
\\!
II
(J
o
U
U
u
1.67
o
o
o
o
ux;
o
o
o
U
o
o
o
~.21
U
o
o
(J
(J
U
\\!
SQ WK
3.48 2.33
O.xl 0.48
oa
oo
uo
o
u
1 x-+ U 72
u
U
oo
oo
U
o
U
U
U
o
()
o
U.Xl
11
U
o
oo
o
()
o
I)
oo
IJ
IJ
oo
IJ
(J
IJ
o
Total
37.611
11.56
0.00
0.00
0.00
20.00
0.00
0.00
0.00
0.00
0.00
2.50
0.00
IUlO
0.00
0.00
1.31
0.00
0.011
(1.011
0.54
IUHI
0.00
0.00
0.00
SS
5.247
2-f(J
0.00
0.00
0.00
1.08
0.00
u.ou
O.UO
0.00
0.00
0.93
0.00
(JOI)
000
0.00
lUlU
0.00
I).UO
0.00
U.OO
IU)IJ
UIJU
OIJIJ
(Jill!
HT
30.516
9.10
0.00
(l.OO
(LOU
IS.92
0.00
0.00
UUU
U.UU
0.00
1.57
0.00
(UIU
0.00
0.00
(UII)
U.OU
IWI)
IJ.(IO
IJ.(JIJ
(!.II\\!
000
IJ.OO
IJ.IJI)
RD
1.8485
0.00
0.00
a.oo
u.oo
u.oo
0.00
Il.OO
U.OO
UOO
0.00
0.00
0.00
lUlU
O.UU
0.00
UI
U.OO
IU)U
U.UO
IJ.5-+
lUlU
(J.llU
IJ.OU
O.OU
Total
606.58
11.14
101.76
o
o
6.88
o
18.67
2.09
o
o
o
o
1.12
o
33...19
o
o
II
418.03
11.03
2.(11
II
LQ RD HT
41.62 443.1 50.73
5.36 5.n
o
-+.88 9.75 J I 53
079 b.09
o
0.-+2
o 11.97
u oo
1.12
oo
-+.2'.! IX.OI -+.04
I)
o
()
19. ~l)
5 II
u
~l)7 ;;;;
~ 92
o
1.18
o
2 III
.Page 22 of 2

3.5 Page 25

▲back to top
II '
00
fl
()
l)
II
II
LlIlI1ic~\\:IlJ
I
n.3
11.1)6
0
0
l)
1J
0
I)
II
n
0
n
0
II
oI n
0
0
0
0
II
0
0
() O(J
0
(J
(I O.on
n.oo (JOO 000
oI
01
oj
0
0
Il
0.00
0.00
o.(/() 0.00
01
01 01 n
II
(l
0.00
(100
0.00
(Ulll
0
n
I)
n.oo
(l.on
0.00
(lOll
0.3
(1.2(,
il.(l~
II
n
0
0.00
O.O(J
n.on
(J.n!)
0.06
0 0.0(,
(l
0
0
0.00
n.oo
0.00
f).I)O
0
1.71
07R
nY,
o (I( ~
0
0
[I
n
()
0
6R
521
(,21
1745
1705
1726
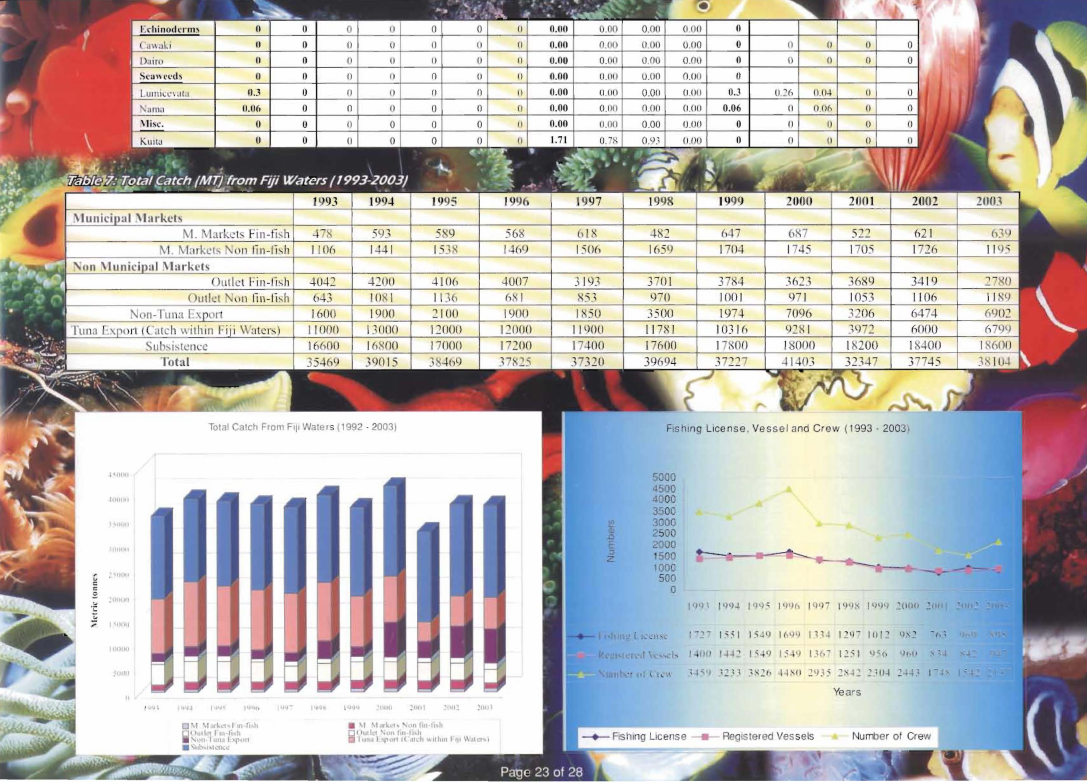
Total Catch From Fill Waters (1992 ·2003)
l'lUItI
. lUIIO
'h'lI
IUl~1I
<c:­
tllW
..ce:
IIIlH
~
,.
I III III
1I1IlUH
"Illrrt
II "
.,IJ ~ ~
I"'~~
-.';-'
1~1J(
IIJI',-,
t',·.'j
UIIIl
~ltilt
:1I11!
~11111
."
~.
'~_
I
..
FIshing License. Vesseland Crew (1993 - 2003\\
sooo
<1500
000
SOC
3000
2500
2000
z
"GO
1100
500
o
-.
1'''1\\ I'N~ 1<)'1 ; 1'1116 Jql)~ 19'.IX i l/Q"} 2(11)() 2(111 1
I~~I Iq'l 1(;9" In-l 12')­ 1012 'q;"~ - h:
/41111 I-1J' Iql) 154<) 1J/,­ 12:; 1 l) 'c' qt,\\1
~ 1,1) .~ .: .1 -~ .,,,2" -1-L'P 2'1.15 2,-12 2 \\11-1 2----1.' 1-:'
Years

3.6 Page 26

▲back to top
-".­
'K~
'\\t"
")
....
~-..(.~v.]..."~ laI
TARIFF ITEM
03011000
03019100
03019900
03021900
03022900
03023100
03023200
03023300
03023400
03023900
03026500
03026900
03031900
03032900
03033900
03034100
03034200
03034300
03034400
03034900
03037400
03037500
03037900
03041000
03042000
03049000
03054900
03056900
03061900
03072100
03072900
03073900
03073900
c~ 03079100
.. , 03079100
.,..03079900
DESCRIPTION
LIVE ORNAMENTAL FISH
LIVE FISH.
LIVE AQUIRUM FISH
FROZEN FISH
CHILLED FISH
ALBABORE TUNA
FROZEN YELLOW FIN TUNA.
STRIPE MARLIN
BIGEYE TUNA
SWORD FISH & OTHER CHILLED FISH
Frozen SHARK'S MEAT
Mixed Frozen FISH
Mixed Frozen FISH
Mixed Frozen FISH
Mixed Frozen FISH
FROZEN ALBACORE
FROZEN YELLOWFIN TUNA
FROZEN SKIPJACK TUNA
FROZEN TUNA LOINS
Mixed Frozen FISH
Mixed Frozen FISH
SHARKS FIN
Mixed Frozen FISH
CHILLED FISH
CHILLED FISH
FRESH VACUUM PACKED FILLETS
DRIED FISH
DRIED FISH
SHRIMPS, frozen fish & bech de mer
CHILLED FISH.
BECHE-DE -MER
FROZEN MUSSELS
LIVE CORALS
DRIED BEACH-DE-MER
CORAL & CLAMS
BEACH-DE-MER
TOTALS
NET MASS (Kg)
217668
9285
44263
114963
804091
274008
2424888
1823
223444
1220614
64229
66814
94099
74483
37032
9118844
1448333
153004
42937
682195
76753
484834
515949
1819171
4532
146817
6145
24801
7663
80324
19727
6269
13946
16342
5494
241744
20587528
Export Value (F$
$
134,251
$
76,861
$
204,522
$
695.764
$
363.873
$
1,654,303
$
20,030,098
$
9,132
$
1,026,229
$
6,236,529
$
144,902
$
231,891
$
273,436
$
278,969
$
101,988
$
24,310,933
$
3,057.792
$
259,225
$
287,951
$
11,171,506
$
179,842
$
7,271,978
$
2,990,502
$
11,376,273
$
22,068
$
1,678,815
$
207.715
$
792,343
$
103,510
$
515,254
$
598,418
$
89,665
$
119,939
$
1,252,113
$
145,632
$
6,573,236
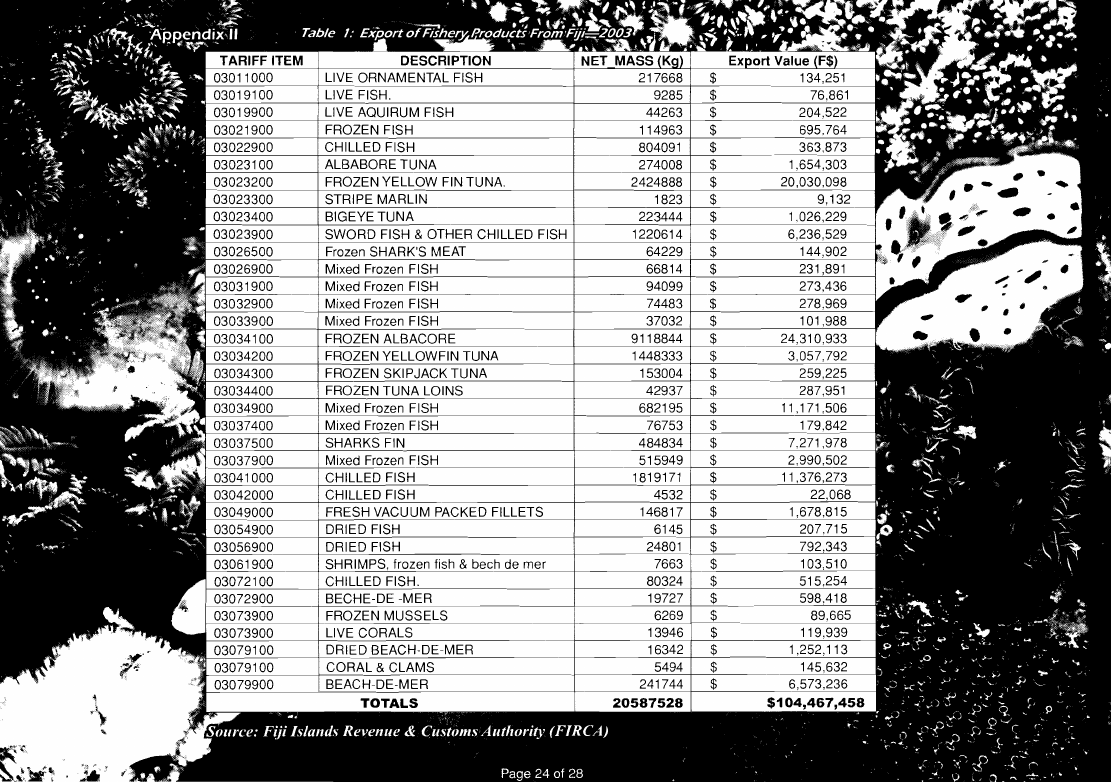
$104,467,458

3.7 Page 27

▲back to top
1 nn.,u
217M
7X.X35
3XO
.:1.601
(h.,ter (L"e)
900
19.62X
\\hb,e! (Li,'e)
Squid
2760
3395
33.96.:1
27 .xn
OctODUS
2404
14.624
Other,
,,'576.16
149.632
ScalloDs
MllSscls
" 113.5
301n.59
60J1l2
66.479
Salmon
4X25.b
26.X48
Herring"
1289.1-;5
9.37:2
Presened ri,h (Sardine)
140nxo
403.991
Tllna In Oil
3684.:160 x.XO.:l.325
X6009td I.7l7.X6X
Ant:h{n ll..'~
1311
17.262
Other run;1
49701
10X,386
Mackeral In Oil
2077I.iJ
12X.iJ17
Ca\\lor & ('avlOr substitutes
Crab,
Shril11D' and Prawn,
200
13x I
791U2 I
UO I
692
5.25X
Prcscn cd Anchovic;-;
Flour,. \\1eab & pellct:> of cl'Ustaccam.
l11olluSl·'. inver".
596 I
4.525
3463370 I 2.27X.XIX
Products of Fi,h
200
514
Other
65691
106.X77
Other
97301.5
147.072
Scaw('cu and othc} aL.!ac
174X.6
lX..:I52
FI,h Liver OIl
100
.:103
Fats. Oib and thell (ractlmb offi,h
250
99X
Pearb
25
1.082
Worked PC'arl,
Worked i\\'orv bone, tUrtOI'" shell.
l[mal.MOP·
I
BUIIOII> or bulton blanh of pearl and
trochu,­
(l.1
l)0071
IOX.2
S90
I 7.:1..:191
3.2XI
Pearl or Trochlh Shell Blank
40
3.251
Other Button Blanks
16023.69
472.32iJ
Sub Totals (kg)
38983016.811 78,733,138
:\\UUlbers Value ($)
Oman1l'nlal Ji,h
210
2.565
SubTotals
210
25()5
~
,
'''' 2.00
13.17
" 2.18
.~, I

3.8 Page 28

▲back to top

3.9 Page 29

▲back to top

3.10 Page 30

▲back to top
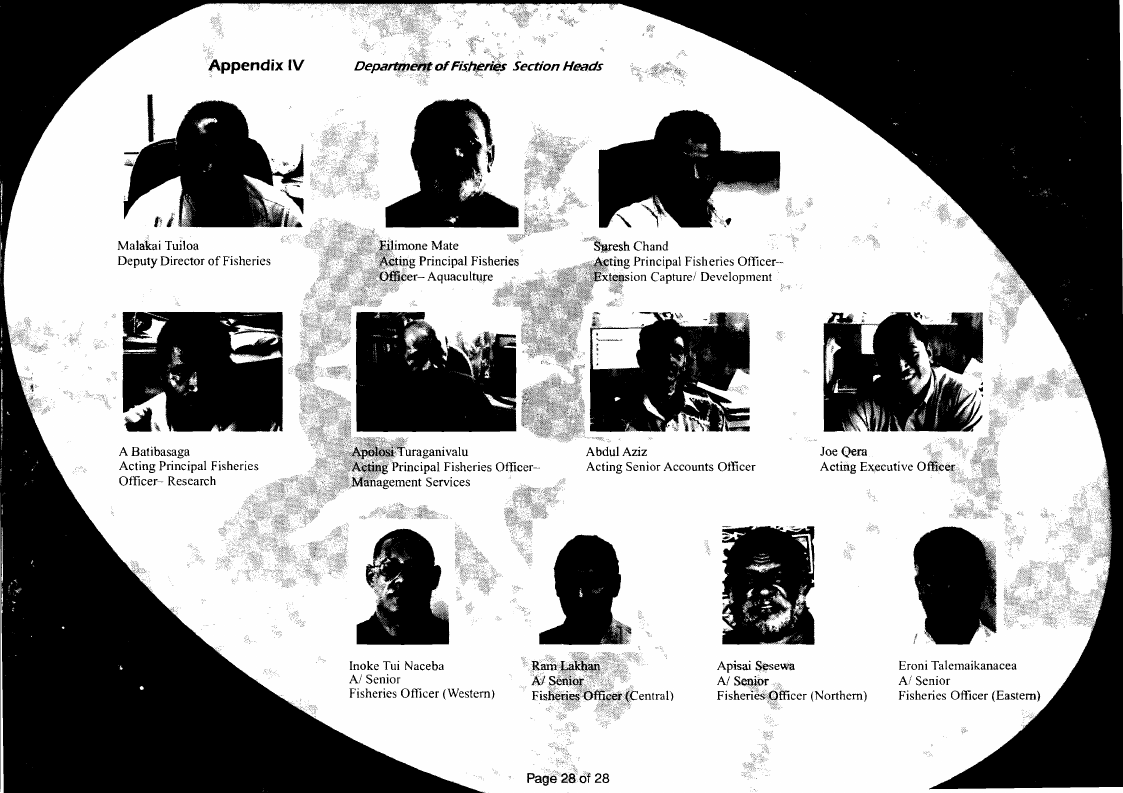
Appendix IV
ofFi~hp~ Section Heads
Malakai Tuiloa
Deputy Director of Fisheries
6"SWeSh Chand
iug Principal Fisheries Officer­
ion Capturel Development
uraganivalu
'rincipal Fisheries Officer­
cment Services
Abdul Aziz
Acting Senior Accounts Otliccr
Joe Qe.ra
Acting Ex,ecutive 0
Inoke Tui Naceba
AI Senior
Fisheries Officer (Western)
Apisai Sesewa
AI Senior
Fisheri~seOfficer (Northern)
Eroni Talemaikanacea
AI Senior
Fisheries Officer (Eastern)

4 Pages 31-40

▲back to top

4.1 Page 31

▲back to top
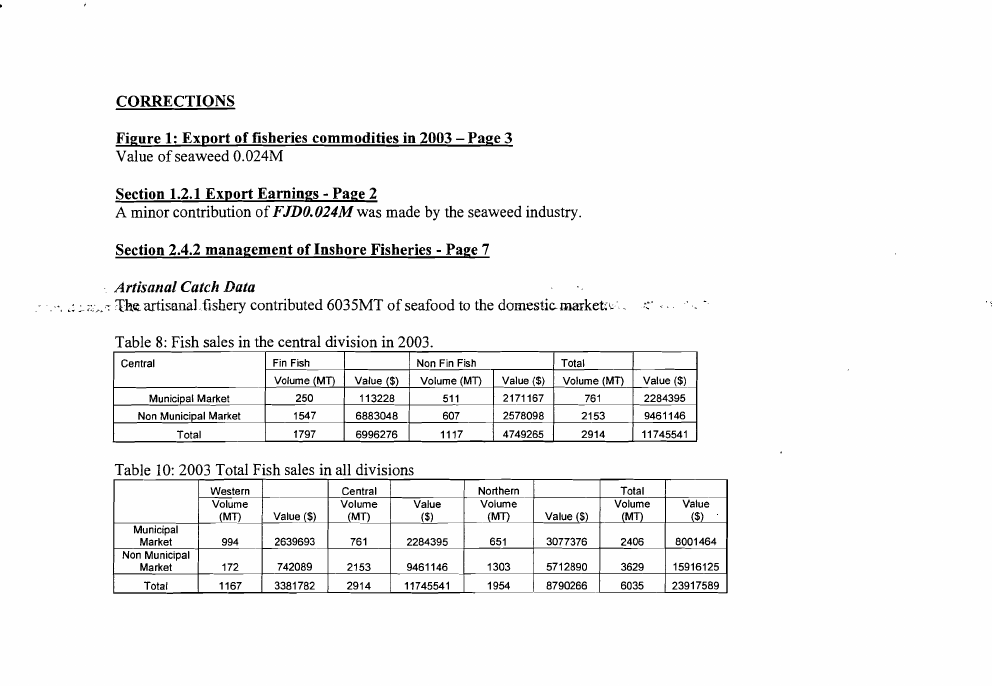
CORRECTIONS
Figure 1: Export of fisheries commodities in 2003 - Page 3
Value of seaweed 0.024M
Section 1.2.1 Export Earnings - Page 2
A minor contribution of FJDO.024Mwas made by the seaweed industry.
Section 2.4.2 management of Inshore Fisheries - Page 7
Artisanal Catch Data
..., ,: ~. ~.~..-: 1h~ artisanal.fishery contributed 6035MT of seafood to the domestic.market'"
.......
"
..,
. ':
Table 8: Fish sales in the central division in 2003.
Central
Municipal Market
Non Municipal Market
Total
Fin Fish
Volume (MT)
250
1547
1797
Value ($)
113228
6883048
6996276
Non Fin Fish
Volume (MT)
511
607
1117
Value ($)
2171167
2578098
4749265
Total
Volume (MT)
761
2153
2914
Value ($)
2284395
9461146
11745541
Table 10: 2003 Total Fish sales in all divisions
Municipal
Market
Non Municipal
Market
Total
Western
Volume
(MT)
994
172
1167
Value ($)
2639693
742089
3381782
Central
Volume
(MT)
761
2153
2914
Value
($)
2284395
9461146
11745541
Northern
Volume
(MT)
651
1303
1954
Value ($)
3077376
5712890
8790266
Total
Volume
(MTI
2406
3629
6035
Value
($)
8001464
15916125
23917589

4.2 Page 32

▲back to top
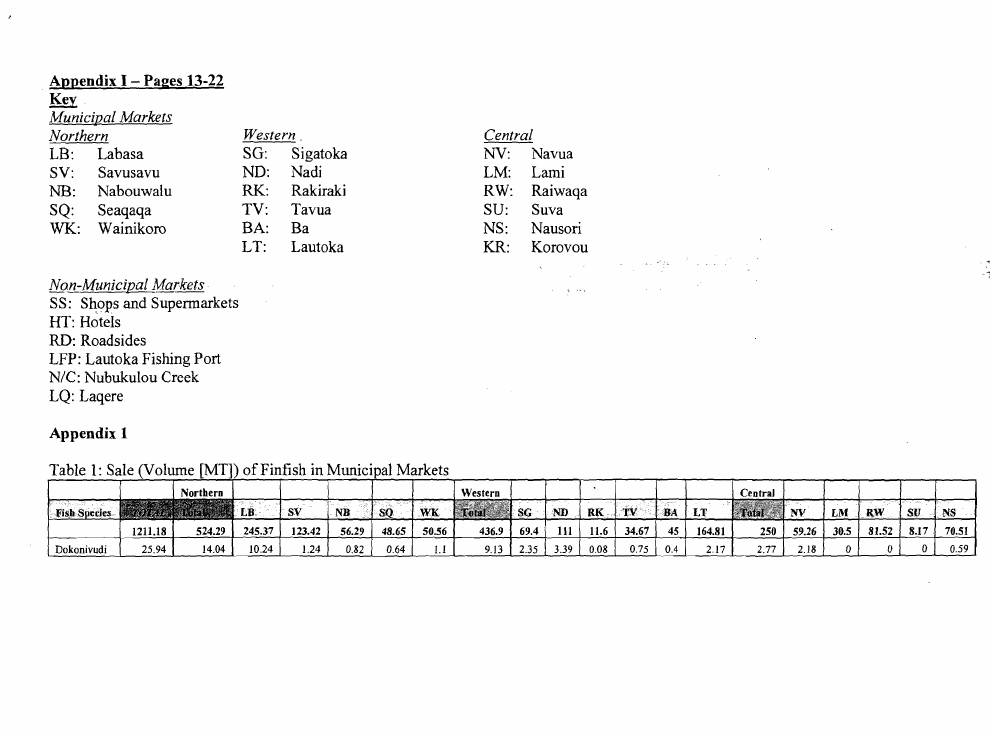
Appendix I - Pages 13-22
Key
Municipal Markets
Northern
Western .
Central
LB: Labasa
SG: Sigatoka
NY: Navua
SV: Savusavu
ND: Nadi
LM: Lami
NB: Nabouwalu
RK.: Rakiraki
RW: Raiwaqa
SQ: Seaqaqa
TV: Tavua
SU: Suva
WK.: Wainikoro
BA: Ba
NS: Nausori
LT: Lautoka
KR: Korovou
NOlJ.:Municipal Markets
f
SS: Shops and Supermarkets
HT: Hotels
RD: Roadsides
LFP: Lautoka Fishing Port
N/C: Nubukulou Creek
LQ: Laqere
Appendix 1
Table 1: Sale (Volume [MT]) of Finfish in Municioal Markets
Dokonivudi I 25.94 I
14.04 I
sv
123.42
10.24 I 1.24
NB < SQ
56.29 48.65
0.82 0.64
WI(
I 50.56
1.11
'" SG 'ND RK 1IV BA LT
.,
NV LM RW SU NS
I I 436.9 69.4 III 11.6 34.67 45 164.81
250 59.26 30.5 81.52 8.17 70.51
9.13 2.35 3.39 0.08 0.75 0.4
I I 2.17
2.77 2.18
0
0
0 0.59

4.3 Page 33

▲back to top
Kacika
Kaikai
Kake
Kalia
Kanace
Kasala
Kava
Kavu
Kawago
Kawakawa
Kela
! ., 1 I Kerekerecula
Ki
Kikiti
Koto
Laidamu
Latinidaveta
Lunartaij cod
M. tuna
Mahimahi
Malake
Mama
Marlin
Mataroko
Mataba
Matu
Mollissa
Nuqa
Opakapaka
OgO
Ose
Qio
90.36
44.68
94.63
86.44
346.27
7I.l0
6.52
6.96
137.94
172.62
0.49
0.04
18.81
0.01
14.95
18.65
0.03
0.02
1l.78
IlI.30
0.00
55.11
2.06
17.64
0.00
9.66
11.87
92.31
52.90
90.44
17.64
0.31
42.41
0.00
49.79
50.22
5I.55
45.11
0.00
0.00
67.65
72.34
0.00
0.00
0.00
0.00
0.00
0.00
0.00
0.00
0.00
0.00
0.00
50.26
0.00
0.00
0.00
0.00
49.51
39.47
39.15
0.00
0.00
17.26
0.00
24.44
22.96
19.73
19.12
0.00
32.64
34.47
0.0.0
0,00
0.00
0.00
0.00
24.21
0.00
0.00
0.00
0.00
19,31
18.92
27.64
0.00
10.28
6.65
5.79 2.43
1.73
1.45
0.00 0.00 000 0.00 0.06
0.00
936
727
7.86 0,86
1.64
0,88
14.86 6.88
3.28 2.24
6.97
6.91
17.10 7.95
2.60 4.17
0.64
0.31
935 9.11
4.74 2.79
0.46
0.00
0.00
0.00
0.00
0.00
000 0.00
0.30
0.00
15.61
6.20
7.96 5.24
5.13
2.47
16.53 939 6.52 5.43 12.75
4,34
0,00
'.'- 0.00
..0.00
.•
0.00 0.10
" , .. ~ ~_., ~-6:.0-4- l
'
0.0.-0"·-·1, --0-.0_0.· -.-.----:',-"O,---.;;..z.,..o..-:-of~--r---o'.~.-ot;-:-
0.05
0.00
0.00
0.00
0.00
0.00
0.00
0.00 0.00 0.00 0.00 0.79
0.12
0.03
0.03
0.02
0.00
0.00
0.00
0.00 0.00
0.76
0.20
0.00 000 0.00 0.00 0.64
0.64
0.00
0.00
8.75 13.15
3.40 0.75
0.99
0.52
0,00
0.00
0.00 0.00
0.20
0.00
0.00 0.00 0.00 000 0.00
0.00
0.00
0.00
0.00 0.00 0.00 0.00 0.05
0.00
0.00 000 0.00 0,00 0.07
0.00
13.50 8.74 631 1.65 0.13
0.02
9.90 5.26 3.95 1.44 1.28
0.89
6.82 3.20 0.56 0.93 11.77
0.55
0.00 0.00 0.00 0.00 0.13
0.09
0.00
0,00
0.00
0.00
0.00
0.02
0.00
0.00
0.00
0.00
0.00
5.50
0.00
0.00
0.00
0.00
0.00
0.00
0.00
0.00
0.00
0.00
0.00
0.00
0.20
0.00
0.00
0.00
0.00
0.00
0,39
0.20
0.00
000
0.01
0.00
0.13
0.03
0.06
0.13
0.00
0.13
0.34
0.65
0.00
0.00
0.00
0.00
0.00
0.14
0.00
0.00
0.02
0.00
0.00
0.09
0.00
0.00
0.00
0.01
0.06
0.01
0.00
2.42
0.02
0.00
0.27
0.06
0.62
am
0.27
033
0.00
0.16
232
2.25
0.05
0.04
0.01
0.00
0.00
0.53
0.00
0.02
0.54
0.00
0.00
037
0.00
0.00
0.00
om
0.01
0.10
0.00
8.60
0.02
0.00
46.22
44.62
43.20
29.25
294.08
25.53
6.52
6.66
65.16
87.53
0.39
18.80
0.01
14.95
17.86
11.02
9.66
3.86
1.86
17.64
9.61
11.80
42.67
12.l5
39.52
17.51
0.31
13.60
IUO
10.55
8.87
12.00
5.29
5.35
2.35
17.15
17.21
0.00
9.10
0.00
8.29
3.30
8.81
3.13
0.00
0.69
8.58
9.02
8.78
9.93
1.22
8.82
5.93
0.00
0.85 28.40 1.23 2.14
1.74 31.68 0.00 0.00
2.59 20.08 0.00 9.98
0.00 9.96 0.87 9.55
5.06 24.60 3.01 249.41
1.17 18.68 039 0.00
1.17 0.00 0.00 0.00
3,59 0.00 0.28 0.44
2,66 30.72 4.29 10.34
634 31.46 13.61 18.91
0,39
. 0,00
. ~.
"
0.00
0.00 ,
- t' '
.'
\\.\\:
.'-----
':.:~I
i
-
.-- 072 . 8.9&., ,.".,J).OO t-.A!~!t ~.:;
0.01 0.00 0.00 000
0,00 6.66 0.00 000
4.45 332 0.27 6,52
0.23 0.00 1.98 0.00
0.94 0.00 2.81 2.78
0.00 2.80 1.06 0.00
1.17 0.00 0.00 0.00
0.16 8.90 0.00 0.00
0.59 0.00
1.56 0.00
6.64 10,38
2.11 0.00
2.29 4.72
1.40 10.18
0.31 000
0.00 0.00
0.00 1.46
0.00 15.72
0.00 8.82
3.31 20.38
0.00 000
0.00 0.00

4.4 Page 34

▲back to top
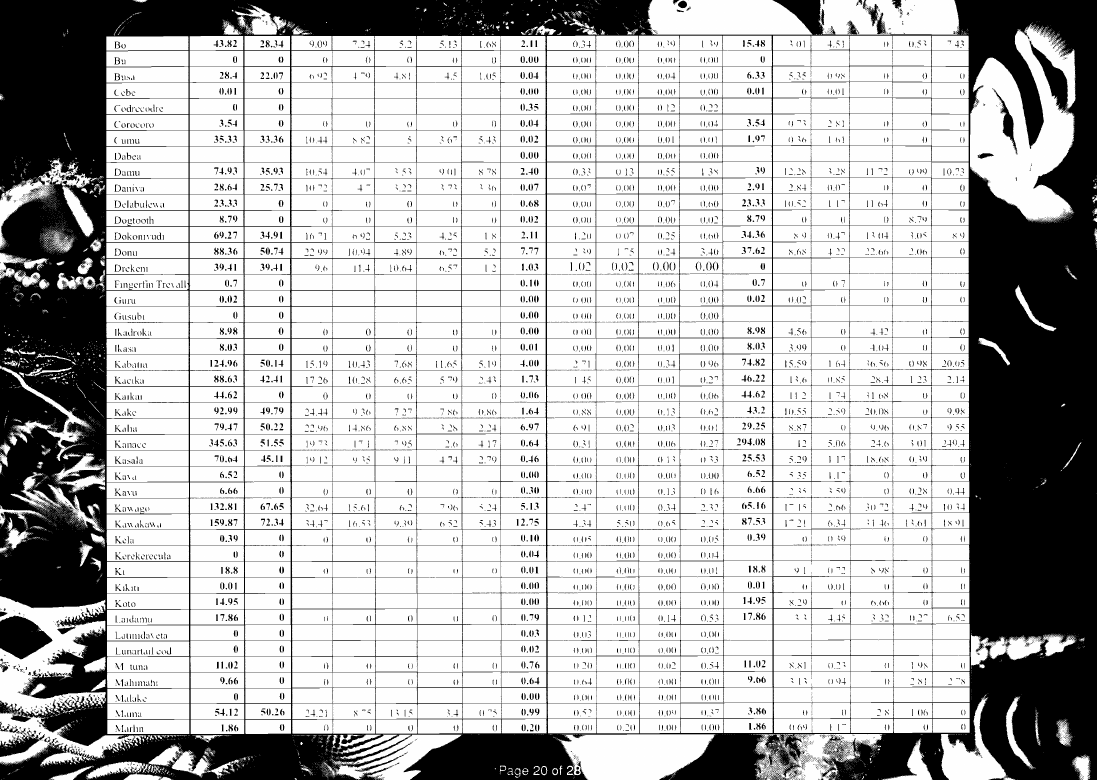
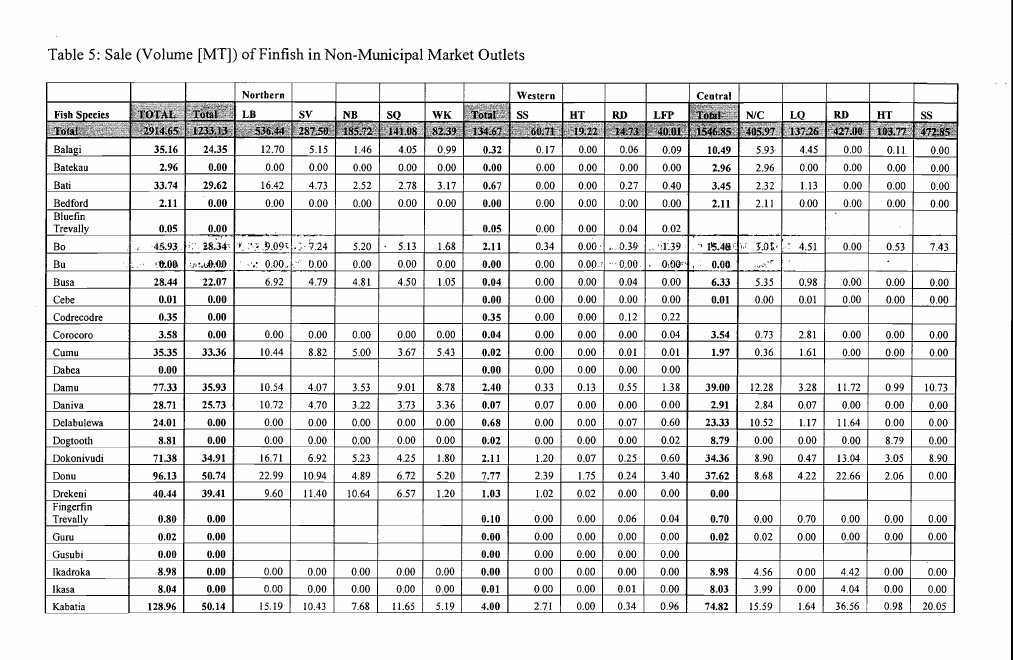
Table 5: Sale (Volume [MT]) of Finfish in Non-Municipal Market Outlets
Fish S e c i e s L B
SV
NB
SQ
WK
SS
HT RD LFP
N/C
RD
HT
SS
Balagi
Batekau
Bati
Bedford
Bluefin
Trevally
Bo
Bu
Busa
Cebe
Codreeodre
Coroeoro
Cumu
Dabea
Damu
Daniva
Delabulewa
Dogtooth
Dokonivudi
Donu
Drekeni
Fingerfin
Trevally
Guru
Gusubi
Ikadroka
Ikasa
Kabatia
35.16
2.96
33.74
2.11
24.35
0.00
29.62
0.00
12.70 5.15
0.00 0.00
16.42 4.73
0.00 0.00
0.05
0.00
----..--.
45:93. ;:. 1.8."34'i 'y. :"'-• .!}M1; ,.~·1.24
, . .. '.11'.00. 'ji!.,j).(lJ) - .'.~ 0,00" . 0.00
28.44 22.07
6.92 4.79
0.01
0.00
0.35
0.00
3.58
0.00
0.00 0.00
35.35 33.36
10.44 8.82
0.00
77.33 35.93
10.54 4.07
28.71 25.73
10.72 4.70
24.01
0.00
0.00 0.00
8.81
0.00
0.00 0.00
71.38 34.91
16.71 6.92
96.13 50.74
22.99 10.94
40.44 39.41
9.60 11.40
0.80
0.02
0.00
8.98
8.04
128.96
0.00
0.00
0.00
0.00
0.00
50.14
0.00
0.00
15.19
0.00
0.00
10.43
1.46
0.00
2.52
0.00
5.20
0.00
4.81
0.00
5.00
3.53
3.22
0.00
0.00
5.23
4.89
10.64
0.00
0.00
7.68
4.05
0.00
2.78
0.00
5.13
0.00
4.50
0.00
3.67
9.01
3.73
0.00
0.00
4.25
6.72
6.57
0.00
0.00
11.65
0.99
0.00
3.17
0.00
1.68
0.00
1.05
0.00
5.43
8.78
3.36
0.00
0.00
1.80
5.20
1.20
0.00
0.00
5.19
0.32
0.00
0.67
0.00
0.05
2.11
0.00
0.04
0.00
0.35
0.04
0.02
0.00
2.40
0.07
0.68
0.02
2.11
7.77
1.03
0.10
0.00
0.00
0.00
0.01
4.00
0.17 0.00 0.06 0.09 10.49 5.93 4.45 0.00 0.11 0.00
0.00 0.00 0.00 0.00
2.96 2.96 0.00 0.00 0.00 0.00
0.00 0.00 0.27 0.40
3.45 2.32 1.13 0.00 0.00 0.00
0.00 0.00 0.00 0.00
2.11 2.11 0.00 0.00 0.00 0.00
0.00 0.00 0.04 0.02
'--­
0.34 0.00 ' ,. 0.39 .' .:139 -, Jl5.4tF i.i Jilt,­ • 4.51
0.00
0.53
7.43
0.00
0.00' " 0.00
0\\00" , 0.00
. .r
",":'.
0.00 0.00 0.04 0.00
6.33 5.35 0.98 0.00 0.00 0.00
0.00 0.00 0.00 0.00
0.01 0.00 0.01 0.00 0.00 0.00
0.00 0.00 0.12 0.22
0.00 0.00 0.00 0.04
3.54 0.73 2.81 0.00 0.00 0.00
0.00 0.00 0.01 0.01
1.97
0.36
1.61
0.00
0.00
0.00
0.00 0.00 0.00 0.00
0.33 0.13 0.55 1.38 39.00 12.28 3.28 11.72 0.99 10.73
0.07 0.00 0.00 0.00
2.91 2.84 0.07 0.00 0.00 0.00
0.00 0.00 0.07 0.60 23.33 10.52 1.17 11.64 0.00 0.00
0.00 0.00 0.00 0.02
8.79 0.00 0.00 0.00 8.79 0.00
1.20 0.07 0.25 0.60 34.36 8.90 0.47 13.04 3.05 8.90
2.39 1.75 0.24 3.40 37.62 8.68 4.22 22.66 2.06 0.00
1.02 0.02 0.00 0.00
0.00
0.00 0.00 0.06 0.04
0.70 0.00 0.70 0.00 0.00 0.00
0.00 0.00 0.00 0.00
0.02 0.02 0.00 0.00 0.00 0.00
0.00 0.00 0.00 0.00
000 0.00 0.00 0.00
8.98 4.56 0.00 4.42 0.00 0.00
0.00 0.00 0.01 0.00
8.03 3.99 0.00 4.04 0.00 0.00
2.71 0.00 0.34 0.96 74.82 15.59 1.64 36.56 0.98 20.05

4.5 Page 35

▲back to top
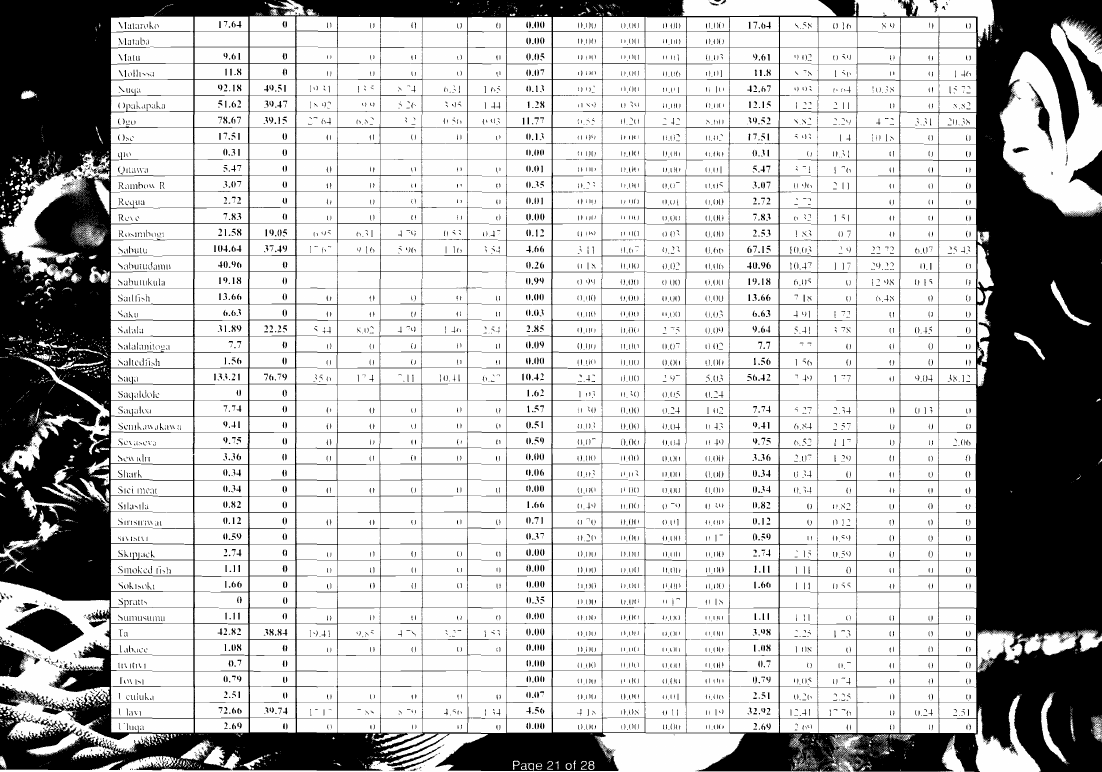
Tovisi
Uculuka
Ulavi
Uluqa
Utouto
Vaidina
Varivoce
Vesa
Voivoi
Votonimoli
Vunavuna
0.7? I
2.58 I
77.22 I
2.69 I
3.37 I
0.61 I
4.49 I
1.05 I
0.31 I
0.00 I
0.00 I
39.74 I
0.00 I
0.00 I
0.00 I
0.00 I
0.00 I
0.00 I
I
0.00 I
17.17 I
0.00 I
0.00 I
0.00 I
0.00 I
0.00 1
I
I
0.00 I
7.88 I
000 I
0.00 I
0.00 I
0.00 I
0.00 I
I
I
0.00 I
8.79 I
0.00 I
0.00 I
0.00 I
0.00 I
0.00 I
I
I
I
0.00 I 0.00 I
4.56 I 1.34 I
0.00 I 0.00 I
0.00 I 0.00 I
0.00 I 0.00 I
0.00 I 0.00 I
0.00 I 0.00 I
I
I
0.00 I
0.07 I
4.56 I
0.00 I
0.21 (
0.00 I
1.36 I
0.00 I
0.00 I
000 I 0.00 I 0.00 I 0.00 I 0.79 I 0.05 I 0.74 I 0.00
0.00 I 0.00 I 0.01 I 0.06 I 2.51 I 0.26 I 2.25 I 0.00
4.18 I 0.08 I 0.11 I 019 I 32.92 I 12.41 I 17.76 I 0.00
0.00 I 0.00 I 0.00 I 0.00 I 2.69 I 2.69 I 0.00 I 0.00
0.00 I 0.00 I 0.03 I 0.18 I 3.16 I 0.00 I 1.95 I 0.00
0.00 1 0.00 I 0.00 I 0.00 I 0.61 I 0.26 I 0.35 I 0.00
1.23 I 0.D7 I 0.01 I 0.05 I 3.13 I 078 I 1.18 I 0.00
0.00 I 0.00 I 0.00 I 0.00 I 1.05 I 0.00 I 1.05 I 0.00
0.00 I 0.00 I 0.00 I 0.00 I 0.31 I 0.00 I 0.31'1 0.00
0.00 I 0.00
0.00 I 0.00
0.24 I 2.51
0.00 I 0.00
1.21 I 0.00
0.00 I 0.00
0.00 I 1.17
0.001 0.00
000 I 0.00
.~,
...
,..,,..
.". ~
W"ltebait
Yatule
Yavula
Yawa
Yellowfin
Others
0.01 I
1.35 I
0.40 I
10.07 I
4.99 I
0.00 I
0.00 I
0.00 I
0.00 I
0.00 I
I
0.00'
0.00 I
0.00 I
I
I
0.00 I
0.00 I
0.00 I
I
I
0.00 I
0.00 I
0.00 I
I
I
I
0.00 I 0.00 I
0.00 I 0.00 I
0.00 I 0.00 I
I
I
0.01 I
0.05 I
0.13 I
1.83 I
4.99 I
0.00 I 0.00 I 0.00 I 0.01
0.00 I 0.00 I 0.04 I 0.01
0.00 I 0.00 I 0.01 I 0.12
0.78 I 0.95 I 0.07 I 0.02
2.90 I 1.88 I 0.07 I 0.14
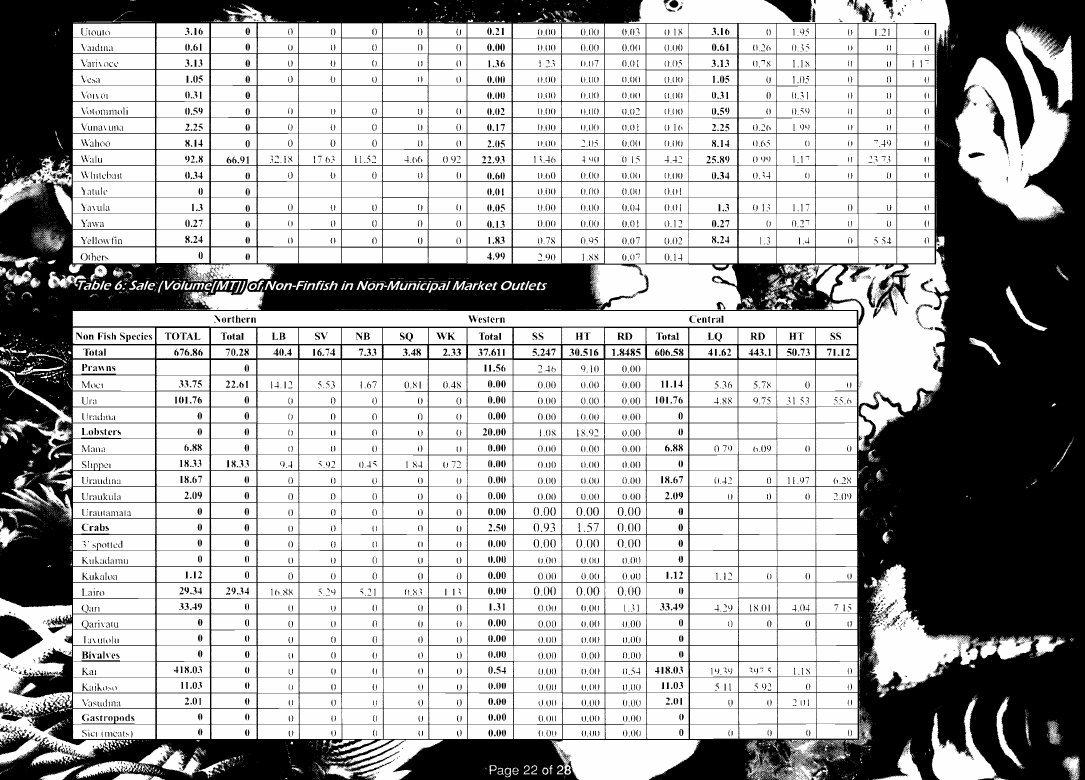
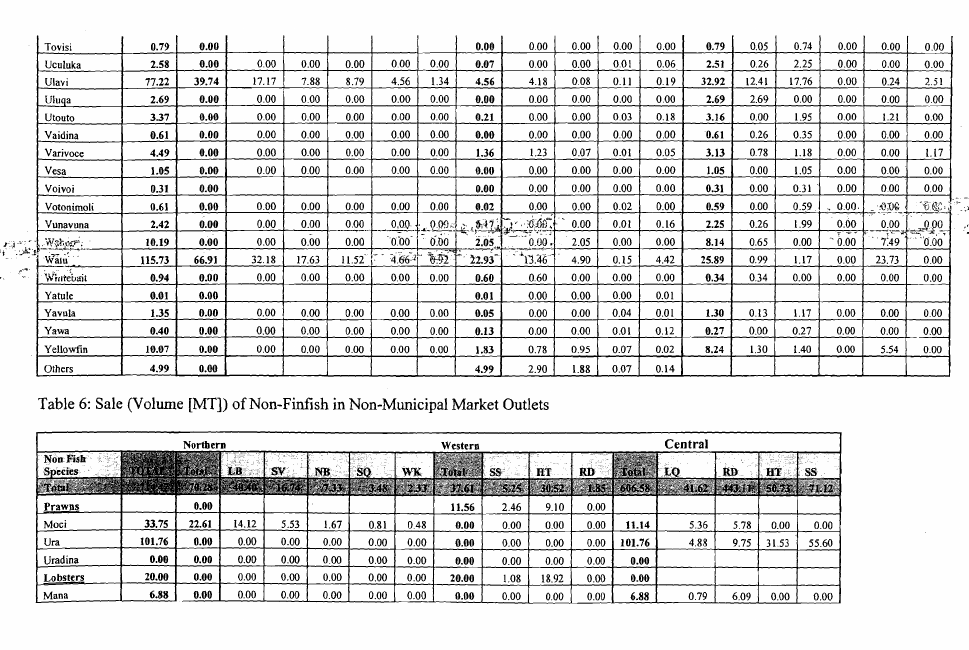
Table 6: Sale (Volume [MT]) of Non-Finfish in Non-Municipal Market Outlets
1.30 0.13 1.17 0.00 0.00 I 000
0.27 0.00 0.27 0.00 0.00 I 0.00
8.24 1.30 1.40 0.00 5.54 ) 0.00
Prawns
Mod
Ura
Urad ina
Lobsters
Mana
0.00
33.75 22.61 14.12 5.53 1.67
101.76 0.00 0.00 0.00 0.00
0.00 0.00 0.00 0.00 000
20.00 0.00 0.00 0.00 0.00
6.88 0.00 0.00 0.00 0.00
0.81 0.48
0.00 0.00
0.00 0.00
0.00 0.00
0.00 0.00
11.56
0.00
0.00
0.00
20.00
0.00
2.46 9.10
0.00 0.00
0.00 0.00
0.00 0.00
1.08 18.92
0.00 0.00
0.00
0.00 11.l4 I
I 0.00 101.76
0.00 0.00
0.00 0.00
0.00 6.88 I
I 5.36 I 5.78 I 0.00 0.00
I I 4.88 9.75 31.531 55.60
0.79 I 6.09 I 0.00 I 0.00

4.6 Page 36

▲back to top
Qitawa
Rainbow R
I 5.48 I 0.00 I
I 3.42 I 0.00 I
0.00 I 0.00 I 0.00 I 0.00 I 0.00 I 0.01 I
0.00 1 0.00 I 000 I 0.00 I 0.00 I 0.35 I
0.00 I 0.00 1 0.00 I 0.01 I
0.23 I 0.00 I 0.Q7 I 0.05 I
5.47 I 3.71 I 1.76 I 0.00 I 0.00 I 0.00
3.07 I 0.96 I 2.11 I 0.00 I 0.00 I 0.00
Requa
2.73
0.00
0.00 0.00 0.00 0.00 0.00 0.01
0.00 0.00 0.01 0.00
2.72 2.72
0.00 0.00 0.00
I Reve
7.83
0.00
0.00 0.00 0.00 0.00 0.00 0.00
0.00 0.00 0.00 0.00
7.83
6.32
1.51
0.00
0.00
O.O~
Rosinibo~i
21.70 19.05
6.95 6.31 4.79 0.53 0.47 0.12
009 0.00 0.03 0.00
2.53 1.83 0.70 0.00 0.00 0.00
Sabutu
I 109.30 I 37.49 I 17.67 I 9.16 I 5.96 I 1.16 I 3.54 I 4.66 I 3.11 I 0.67 I 0.23 I 0.66 I 67.15 I 10.03 I 2.90 I 22.72 1 6.07 I 25.43
Sabutudamu I 41.22 I 0.00 I
I
I
I
I 0.26 I 0.18 I 0.00 I 0.02 I 0.06 I 40.96 I 10.47 I 1.17 I 29.22 I 0.10 I 0.00
Sabutukula
Sailfish
I 20.17 I 0.00 I
I 13.66 I 0.00 I
I
I
I
I
I 0.99 I
0.00 1 0.00 I 0.00 I 0,00 I 0.00 1 0.00 I
0.99 I 0.00 I 0.00 1 0.00 I 19.18 I 6.05 I 0.00 I 12.98 I 0.15 I 0.00
0.00 I 0.00 I 0.00 I 0.00 I 13.66 I 7.18 I 0.00 I 6.48 I 0.00 I 0.00
·., cSakll-~,;..,.. _,_. 6.66
-.­ - ISabila5-Z~ ~;, :.:"34.74
_r - -rt:Sldalati'itoga:t'::'"~ ~ 7.79
Salted fish
1.56
Saqa
I 143.63 I
0.00
22.25
0.00
0.00
76.79 I
0.00 0.00
5.44 8.02
0.00 0.00
0.00 0.00
35.60 I 17.40 I
0.00
4.79
0.00
0.00
7.11 I
0.00 0.00 0.03
0.00 0.00 0.00
1.46 '2.54 . '2:85 ··~::.'QM:2i'b.0~;:':"·2'.75
0.00 _ 0.00 " , 0:09
0.00 ;. '."0.00 . 0.07
0.00
~.
'r\\ ~---..J~
. "",1'1-:--"- ,~ ",. ~'.:'V ':_ •
0.00
0.00' . '0.00' - OW' 7.; 0.00
10.41 I 6.27 I l0A2 I 2.42 I 0.00 I 2.97 I
0.03
0.09
0.02
0.00
5.03 J
6.63
9.64
7.70
1.56
56.42 I
4.91
5.41
7.70
1.56
7.49 I
1.72. 0.00
3.78 0.00
0.00 0.00
0.00 0.00
1.77 I 0.00 I
0.00 0.00
0.45 0.00
0.00·' 0.00
0.00;_' :JtQO ~--y
9.04 I 38.12
Saqaldole
I 1.62 I 0.00 I
I
I
I
1
I 1.62 I 1.03 I 0.30 I 0.05 I 0.24
=='----I--::..:=.;=-t---=-=--I--...;;.;..:.~-..:..:..:._=_t-..:..:..:..:e....t-...;;.;..:._'_i---'-'-'--'-_t_---'=...;._t_----'-"'-'--t_-'--''_'____lr_-'-'-___t_~~~J------2~.Q.QQj~--l-----O~
I I I I I I 0.43
9.41 6.84 2.57 0.00 0.00 0.00
Sevaseva
10.34
0.00
0.00 0.00 0.00 0.00 0.00 0.59
0.07 0.00 0.04 0.49
9.75 6.52 1.17 0.00 0.00 2.06
~ewidri
3.36
0.00
0.00 0.00 0.00 0.00 0.00 0.00
0.00 0.00 0.00 0.00
3.36 2.07 ) .29 0.00 0.00 0.00
Shark
0.40
0.00
0.06
0.03 0.03 0.00 0.00
0.34 0.34 0.00 0.00 0.00 0.00
Sici meat
I 0.34 I 0.00 I 0.00 I 0.00 I 0.00 I 0.00 I 0.00 I 0.00 I 0.00 I 0.00 I 0.00 I 0.00 I 0.34 I 0.34 I 0.00 I 0.00 I 0.00 I 0.00
Silasila
I 2.48 I 0.00 I
I
I
I
I
I 1.66 I 0.49 I 0.00 I 0.79 I 0.39 I 0.82 I 0.00 I 0.82 I 0.00 I 0.00 I 0.00
Sirisiriwai
I 0.83 I 0.00 I
0.00 I 0.00 I 0.00 I 0.00 I 0.00 I 0.71 I 0.70 I 0.00 I 0.01 I 0.00 I 0.12 I 0.00 I 0.12 I 0.00 I 0.00 I 0.00
sivisivi
I 0.96 I 0.00 I
I
I
I
I
I 0.37 I 0.20 I 0.00 I 0.00 I 0.17 I 0.59 I 0.00 I 0.59 I 0.00 I 0.00 I 0.00
Skipjack
2.74
0.00
0.00 0.00 0.00 0.00 0.00 0.00
0.00 0.00 0.00 0.00
2.74 2.15 0.59 0.00 0.00 0.00
~~oked fish
1.11
0.00
0.00 0.00 0.00 0.00 0.00 0.00
0.00 0.00 0.00 0.00
1.11 1.11 0.00 0.00 0.00 0.00
~kisoki
1.66
0.00
0.00 0.00 0.00 0.00 0.00 0.00
0.00 0.00 0.00 0.00
1.66 1.11 0.55 0.00 0.00 0.00
Spratts
0.35
0.00
0.35
0.00 0.00 0.17 0.18
Sumusumu
I Ta
1.11
42.82
0.00
38.84
0.00 0.00 0.00 0.00 0.00 0.00
19.41 9.85 4.78 3.27 1.53 0.00
0.00 0.00 0.00 0.00
0.00 0.00 0.00 0.00
1.11 1.11 0.00 0.00 0.00 0.00
3.98
2.25
1.73
0.00
0.00
I 0.00
Tabace
1.08
0.00
0.00 0.00 0.00 0.00 0.00 0.00
0.00 0.00 0.00 0.00
1.08 1.08 0.00 0.00 0.00 0.00
tivitivi
I 0.70 I 0.00 I
I
I
I
I
I 0.00 I 0.00 I 0.00 I 0.00 I 0.00 I 0.70 I 0.00 I 0.70 I _0.00 I 0.00 I 0.00

4.7 Page 37

▲back to top
Slipper
Uraudina
Uraukula
Urautamata
Crabs
3' spolled
Kukadamu
Kukaloa
Lairo
Qari
'j. .,I ~_~iw-l:-I,'vu-~>:.:
. ~~~t:ollt·~·
Bivalves
Kai
Kaikoso
Vasudina
GastroDods
Sici (meats)
Echinoderms
Cawaki
Dairo
Seaweeds
Lumicevata
Nama
Misc.
Kuita
18.33 18.33 9.40 5.92 0.45
18.67 0.00 0.00 0.00 0.00
2.09 0.00 0.00 0.00 0.00
0.00 0.00 0.00 0.00 0.00
2.50 0.00 0.00 0.00 0.00
0.00 0.00 0.00 0.00 0.00
0.00 0.00 0.00 0.00 0.00
I.l2 0.00 0.00 0.00 0.00
29.34 29.34 16.88 5.29 5.21
34.80 0.00 0.00 0.00 0.00
0.00 0.00 0.00 0.00 0.00
0.00 0.00 0.00 0.00 0.00
0.00 0.00 0.00 0.00 0.00
418.57 0.00 0.00 0.00 0.00
11.03 0.00 0.00 0.00 0.00
2.01 0.00 0.00 0.00 0.00
0.00 0.00 0.00 0.00 0.00
0.00 0.00 0.00 0.00 0.00
0.00 0.00 0.00 0.00 0.00
0.00 0.00 0.00 0.00 0.00
0.00 0.00 0.00 0.00 0.00
0.00 0.00 0.00 0.00 0.00
0.30 0.00 0.00 0.00 0.00
0.06 0.00 0.00 0.00 0.00
0.00 0.00 0.00 0.00 0.00
1.71 0.00 0.00 0.00 0.00
1.84 0.72
0.00
0.00 0.00 0.00
0.00 0.00
0.00
0.00 0.00 0.00
0.00 0.00
0.00 0.00
0.00 0.00
0.00 0.00
0.00
0.00 0.00 0.00
0.00 0.00 0.00 0.00
2.50 0.93 1.57 0.00
0.00 0.00 0.00 0.00
0.00 0.00
0.00
0.00 0.00 0.00
0.00 0.00
0.83 1.13
0.00
0.00 0.00 0.00
0.00 0.00 0.00 0.00
0.00 0.00
1.31
0.00 0.00 1.31
r-;,oo. '"-~= ~ -OO~ 0.00 . '-~ ·• .. ·0;'00,;< ,,,·~itM~ I' j ():\\1Ol . 0.00
0.00
0.00 -~ . . . .
0.00
0.00 0.00
0.00
0.00 0.00 0.00
0.00 0.00
0.54
0.00 0.00 0.54
0.00 0.00
0.00
0.00 0.00 0.00
0.00 0.00
0.00
0.00 0.00 0.00
0.00 0.00
0.00
0.00 0.00 0.00
0.00 0.00
0.00
0.00 0.00 0.00
0.00 0.00
0.00
0.00 0.00 0.00
0.00 0.00
0.00
0.00 0.00 0.00
0.00 0.00
0.00
0.00 0.00 0.00
0.00 0.00
0.00
0.00 0.00 0.00
0.00 0.00
0.00
0.00 0.00 0.00
0.00 0.00
0.00
0.00 0.00 0.00
0.00 0.00
0.00
0.00 0.00 0.00
0.00 0.00
1.71
0.78 0.93 0.00
0.00
18.67
2.09
0.00
0.00
0.00
0.00
I.12
0.00
33.49
0.00
0.00
0.00
418.03
11.03
2.01
0.00
0.00
0.00
0.00
0.00
0.00
0.30
0.06
0.00
0.00
0.42 0.00 11.97 6.28
0.00 0.00 0.00 2.09
1.12 0.00 0.00 0.00
4.29 18.01 4.04 7.15
0.00
0.00 0.00
o~ocr
19.39 397.46 1.18 0.00
5.11
5.92 0.00 0.00
0.00 0.00 2.01 0.00
0.00 0.00 0.00 0.00
0.00 0.00 0.00 0.00
0.00 0.00 0.00 0.00
0.26 0.04 0.00 0.00
0.00 0.06 0.00 0.00
0.00 0.00 0.00 0.00
0.00 0.00 0.00 0.00

4.8 Page 38

▲back to top
Appendix I: Table 7 - Page 23
Alterations in the 2003 figures
2003
Municipal Markets
M. Markets Fin-fish
M. Markets Non fin-fish
1211
1195
Non Municipal Markets
Outlet Fin-fish
2915
Outlet Non fin-fish
715
Non-Tuna Export
6902
.I
Tuna Export (Catch within Fiji
Waters)
63241
Subsistence
18600
Total
37861
Appendix II: Table 2 - Page 25
Import of fishery products into Fiji-2003