38_Funafuti Marine Aquarium Resource Report June 07 BY_Final Draft_not to put online_draft

1 Pages 1-10

▲back to top

1.1 Page 1

▲back to top
An underwater visual census survey of
the marine aquarium fish resources of
Funafuti Atoll, Tuvalu
By
Being Yeeting and Tupulanga Poulasi
April 2007
A technical report prepared on behalf of the Fisheries
Department of Ministry of Agriculture and Fisheries of Tuvalu.
Funding for this project was jointly provided by a grant from
MacArthur Foundation, AusAID and the Taiwanese Government

1.2 Page 2

▲back to top
Acknowledgements
I wish to thank the Ministry of Natural Resources and Lands for the support they
gave in conducting this work. Special thanks to the Acting Director of Fisheries,
Mr. Nikolasi Apinelu and my counterpart Mr. Lale Petaia for helping in the
organization of logistics. I also congratulate and thank the team from the
Department of Fisheries in Funafuti, namely Mr. Tupulanga Poulasi, Mr. Tuilawa ,
and Mr. Kilisi Salanoa, who participated in the training and the survey of Funafuti,
without their enthusiasm and willingness to work hard, it would not have been
possible to complete the survey work in the time given. Last but not least a thank
you to Mr. P Holland for his willingness to stay back after work to always ensure
that we have full dive tanks to work with the following day. Thank you team!
BY
2

1.3 Page 3

▲back to top
SPC
ADB
WB
SPREP
RFID
Acronyms
Secretariat of the Pacific Community
Asian Development Bank
World Bank
South Pacific Regional Environment Programme
Reef Fisheries Integrated Database
3

1.4 Page 4

▲back to top
Table of Contents
ACKNOWLEDGEMENTS ......................................................................................................2
ACRONYMS ......................................................................................................................3
TABLE OF CONTENTS........................................................................................................4
LIST OF TABLES ...............................................................................................................5
LIST OF FIGURES ..............................................................................................................6
EXECUTIVE SUMMARY.......................................................................................................7
1. INTRODUCTION......................................................................................................10
1.1 BACKGROUND TO THE STUDY .................................................................................10
1.2 THE MARINE AQUARIUM TRADE..............................................................................10
2. THE COUNTRY OF TUVALU .....................................................................................11
2.1 GENERAL GEOGRAPHY ..........................................................................................11
2.2 THE COASTAL FISHERIES OF TUVALU .....................................................................12
2.3 MANAGEMENT FRAMEWORK...................................................................................13
3. STUDY SITE ..........................................................................................................14
3.1 FUNAFUTI ATOLL ...................................................................................................14
3.2 MARINE RESOURCE MANAGEMENT.........................................................................16
4. OBJECTIVES .........................................................................................................17
5. METHODOLOGY.....................................................................................................17
5.1 UNDERWATER VISUAL CENSUS ...............................................................................17
5.2 SPECIES SELECTION..............................................................................................18
5.3 SUBSTRATE ..........................................................................................................18
5.4 PARAMETERS OF INTEREST ....................................................................................19
5.5 SURVEY DESIGN ...................................................................................................20
5.6 SCALING ...............................................................................................................21
5.7 TRAINING OF LOCAL FISHERIES OFFICERS...............................................................22
6. RESULTS ..............................................................................................................23
6.1 SPECIES NUMBERS AND ABUNDANCE .....................................................................23
6.2 SPECIES SIZE DISTRIBUTIONS ................................................................................24
6.3 STOCK ESTIMATES ................................................................................................24
6.4 SUBSTRATE AND HABITAT ......................................................................................26
7. DISCUSSIONS AND RECOMMENDATIONS .................................................................28
7.1 POTENTIAL OF THE FISH RESOURCES FOR THE MARINE AQUARIUM TRADE................28
7.2 THE MANAGEMENT FRAMEWORK............................................................................29
7.3 THE INFRASTRUCTURE ..........................................................................................29
7.4 FUTURE REQUIREMENTS .......................................................................................30
8. CONCLUSIONS ......................................................................................................31
REFERENCES .................................................................................................................32
APPENDICES ..................................................................................................................34
4

1.5 Page 5

▲back to top
List of Tables
Table 1 List of species with potential for the marine aquarium trade ....................................................19
Table 2 Fish families and numbers of species recorded in the survey ....................................................23
Table 3 Stock estimate by Family Group of Tuvalu Fish.........................................................................25
Table 4 Estimated Stocks of 10 important marine aquarium trade species ...........................................26
Table 5 Percentage coverage of bottom substrates on Funafuti reefs.....................................................27
5

1.6 Page 6

▲back to top
List of Figures
Figure 1. Structure of Community Governance.. .....................................................................................14
Figure 2. Map of Funafuti Atoll with its numerous islets and reef passages ..........................................15
Figure 3. Assessment of finfish resources and associated environments using distance-sampling
underwater visual censuses (D-UVC)........................................................................................18
Figure 4. Location of sampling stations on Funafuti Atoll.......................................................................22
Figure 5 To show the composition of live coral types in the two habitats...............................................28
6

1.7 Page 7

▲back to top
Executive Summary
The international aquarium (freshwater and marine) industry is a multi-billion
dollar business with a current annual worldwide wholesale trade value estimated
at about US$900 million and a retail trade value of about US$3,000 million
The Pacific nations’ role in the international marine aquarium trade has
significantly grown over the past decade with continued expansion expected. It is
currently the only reef fishery that is proving to be commercially viable in
providing a successful ongoing income earning industry and a provider of
employment within the region, especially those land impoverished small island
states, through direct village-based employment, income generation and export
earnings.
Tuvalu is one of the new countries showing an interest in the marine aquarium
trade and in 2004 officially requested the Secretariat of the Pacific Community
(SPC) for assistance to look into this.
In response to the request, in early 2005, SPC conducted a survey of Funafuti
Atoll’s marine aquarium resources to assess the presence and abundance of
potential species. Such survey will provide the first basis of looking at the
feasibility of setting up operations.
Funafuti Atoll is the capital of Tuvalu. It is the largest atoll in the country and has
a population of about 4492 (Census 2002), the highest in the country. It is also
the main port and therefore is the gateway for international travel and trade. Air
Fiji provides two weekly flights between Nausori and Funafuti.
Management of marine resources has followed on from the British colonial
administration, giving free access to all marine resources and total management
responsibility to the Government. More recently several legal instruments have
given more power to the island communities to manage their own resources. All
resource management decisions regarding the entire coastal zone/area of each
island falls under the Island Council and the Falekaupule and therefore
considerations of these authorities is important in any future efforts to develop
exploitation of marine resources.
In addition to assessing the marine aquarium trade resources of Funafuti, the
identification of awareness needs about the marine aquarium trade among the
local community was also conducted and 4 local fisheries officers (divers) were
trained in the resource survey method to give the Fisheries Department the
capacity to be able to conduct other resource appraisals, including monitoring of
the resources in the future.
7

1.8 Page 8

▲back to top
The distance-sampling underwater visual census (D-UVC) method was used
to assess marine aquarium trade finfish resources in Funafuti Atoll. This is the
method that SPC has developed and used to assess reef fisheries resources in
the Pacific region.
All fish species with potential for the marine aquarium trade are assessed using
Pacific export records as the basis, which reports up to 150 fish species from 20
families.
The bottom substrate was also surveyed using a medium scale approach (MSA),
which was also developed by SPC as part of the fisheries resources D-UVC
method.
The results of the survey showed a total of 74 species from 12 families with
potential for the marine aquarium trade. 58 species from 11 families were
reported in the lagoon reef areas and 59 species from 11 families were reported
from the outer reefs.
On the outer reefs, the family Pomacentridae (damselfishes) was the most
common with Pomacentrus vaiuli being the most abundant species with an
average density of 48 individuals per 1000 m2 of reef. Other significant
Pomacentrid species included Pomacentrus pavo, Chromis iomelas, Chromis
margaritifer, and Plectroglyphidodon johnstonianus. Among the Pomacanthids
(angelfishes), Centropyge flavissimus and C. loriculus were the most common.
On the lagoon reefs, again the Pomacentrids were dominant but with Chrysiptera
cyanea being the most abundant species with an average density of 166
individuals per 1000 m2 of reef. Pomacentrus pavo was also very common with
an average density of 117 individuals per 1000 m2 of reef. Looking at other family
groups, the most common Chaetodontid (butterflyfish) in the lagoon was
Chaetodon trifascialis and the most common Pomacanthid (angelfish) was
Centropyge flavissimus.
Looking at the observed sizes of the fish species, generally on average the fish
seen in Funafuti were 50% or less of the known maximum sizes. This was
observed on average in both lagoon and outer reef habitats. Given that these fish
species have not been exploited previously then this could be a natural
phenomenon but more detailed aging work will be needed to verify this.
Using the mean densities of the different species from the survey, and the total
area of lagoon and outer reefs, it was possible to get an estimate of the stock of
each fish species in the two different reef habitats.
Generally, there is an adequate stock of fish species with potential for export in
the marine aquarium trade in Funafuti. Even by just taking 10 of the more popular
8

1.9 Page 9

▲back to top
species and with the provision of setting 10% of the stock estimates to be
available for export, this would still support some small operations.
Even though the resource might be available, this does not mean that a marine
aquarium trade would be automatically feasible to develop. An important area
that needs to be considered carefully before deciding on this is the basic
infrastructure required to support this export industry. The most obvious factor is
the availability of airline connections from Funafuti to the market, including air
cargo space available per flight, air freight rates, the number of transits and
interflight connection delays.
Should the Tuvalu Government choose to go ahead with the development of the
marine aquarium trade in Funafuti then it is very important that a management
plan is developed and put in place. The management plan should take into
account all the administrative bodies that have some relation and legal authority
to all or any part of the coastal marine ecosystem and should also include details
of management measures such as regulations, license conditions and fees, a
monitoring program, an effective enforcement mechanism and a sustainable
source of finance to support all these management activities.
Live coral coverage was 43% in the outer reefs and 33% in the lagoon reefs
which is fairly good. Very little evidence (less than 0.5%).of coral bleaching was
observed on all reefs.
Basically this report is just to give the status of the resources in terms of
presence and abundance of important marine aquarium fish species and with
some guidelines on how this trade should be developed based on other known
successful experiences from elsewhere.
The successful development of a marine aquarium trade would need a lot more
consideration than just the availability of the resource and some commitment
from the government in terms of supporting the next required steps. SPC is able
to provide further advice if required but first of all the Tuvalu government will
need to decide whether they want to move on or not and if so then to further
request SPC assistance.
9

1.10 Page 10

▲back to top
1. Introduction
1.1 Background to the study
At the beginning of 2004, an official request to SPC was received from the
Tuvalu Ministry of Natural Resources and Lands through the Tuvalu Ministry of
Foreign Affairs. The initial request was to assess the abundance of the live reef
food fish resources in all of the Tuvalu atolls and evaluate the feasibility of
starting live reef food fish trade operations in Tuvalu. Due to the lack of funding it
was not possible to respond to Tuvalu’s request immediately and therefore the
assistance was delayed until funds become available.
In early 2005, funds from the SPC Fisheries Minor Projects were made available
to do the work. After some extensive discussion between the SPC and the
Tuvalu Fisheries Department and initial consideration and comparison of
problems and difficulties in live reef food fish trade operations and marine
aquarium trade operations, it was agreed that the work should look at the marine
aquarium fish trade resources first. In addition, instead of conducting the survey
of all atolls of Tuvalu, it was more realistic and fundable to assess one or two
atolls first and train a team of local fisheries officers on the survey method to be
used, to give them the technical capacity to conduct underwater fish surveys and
to extend the survey to the other islands of Tuvalu. After consideration of the
logistics, it was decided appropriate to conduct the survey in Funafuti atoll and to
train the fisheries officers on the UVC method at the same time.
The present report presents results of a baseline survey of the marine aquarium
resources of Funafuti conducted in 2005 by SPC in association with the Tuvalu
Fisheries Department. The survey focused mainly on finfish resources and did
not take into account the invertebrate resources. Some observations were made
on bottom habitat making it possible to give a general description of the status of
the live coral coverage.
1.2 The Marine Aquarium Trade
The international aquarium (freshwater and marine) industry is a multi-billion
dollar business with a current annual worldwide wholesale trade value estimated
at about US$900 million and a retail trade value of about US$3,000 million
(Forum Secretariat, 1999 & Holthus, 2001).
The market for the aquarium trade is dominated by the Unites States, with an
estimated 60 percent of the demand. Western Europe (Germany, France and the
United Kingdom), Japan, Taiwan and Australia constitute the remaining 40
percent of the market (Holthus, 2001). A greater majority of the aquarium fish
species being traded are freshwater species, however marine tropical species
are considered more prestigious and therefore are valued higher.
10

2 Pages 11-20

▲back to top

2.1 Page 11

▲back to top
The Pacific nations’ role in the international marine aquarium trade has
significantly grown over the past decade with continued expansion expected. It is
currently the only reef fishery that is proving to be commercially viable in
providing a successful ongoing income earning industry and a provider of
employment within the region. It is also seen as an industry that is making good
use of fisheries resource, given the fact that the species being traded are not
food fish species and therefore would not be normally utilized otherwise.
The marine aquarium organisms being traded consist of fish species and
invertebrates, live rock, and live corals, with most of these coming mainly from
the tropics. Subsequently, the marine aquarium industry provides a valuable
economic opportunity for Pacific island communities especially in those land
resources-impoverished small island states, through direct village-based
employment, income generation and export earnings.
Regional estimates indicate that over 150 species of marine aquarium fish are
traded by the industry with an estimated annual number of over 400,000
individuals. The export of marine aquarium fish species from the Pacific is
dominated by the Republic of Kiribati which constitutes about 49 percent. The
annual live rock exports for the region are estimated at 700,000 metric tonnes for
2003 with 95 percent of this originating from Fiji.
The SPC member countries that are currently involved in the marine aquarium
industry include: Fiji, Tonga, Vanuatu, Solomon Islands, Cook Islands, Marshall
Islands (RMI), Palau, American Samoa, Kiribati, New Caledonia and French
Polynesia. A few more Pacific countries like Tuvalu are seriously considering
starting marine aquarium trade operations. This includes Nauru, PNG, FSM and
Samoa. In order for these operations to be sustainable, it is vitally important to
have realistic and effective management and monitoring regimes for this trade. A
baseline assessment of the resource forms one of the first important steps in
developing such a fishery and its management plan. It is therefore our hope that
the results of this study would be useful in providing this required baseline which
would be useful also for future reference.
2. The country of Tuvalu
2.1 General Geography
Tuvalu is one of the smallest island nations in the Pacific region and lies west of
the international dateline and 1000 km north of Fiji in the central Pacific just
below the equator (Tuvalu Fact File 1997-1998). This tiny island nation is
comprised of nine very low lying coralline islands scattered over a wide space of
ocean. The islands highest point above sea level is about 3 m. The very sandy
and porous soil is not fertile and hence agricultural opportunities are limited. The
marine resources therefore form an important source of protein and provides the
basis of the mostly subsistence livelihood for the people (see next section).
11

2.2 Page 12

▲back to top
The total population for Tuvalu is less than 10,000 people with an annual growth
rate of 0.5% (Government of Tuvalu, 2002). 47% of this population resides on
Fogafale, the main island of the country’s capital atoll, Funafuti, giving a
population density of about 1,610 people per square kilometers which is one of
the highest population densities in the region.
The primary source of cash income is through government employment which is
especially very significant in Funafuti, the capital atoll, where the government
headquarters are based. Remittances from relatives living and working abroad
including seafarers also provide an important income support to families and
contribution to the economy of the country. Business opportunities exist but are
limited to local scale and include: sale of fish or marine produce, handicraft
production and small retail shops. Export opportunities have been limited by the
lack of good transportation links to overseas markets.
2.2 The Coastal Fisheries of Tuvalu
Fisheries related activities in the country are very limited and fishing is mainly for
local consumption. Reef fishing is the most common fishing activity which
accounts to more than 75% of fishing households. This is due to the accessibility
of reef fishing areas and the ease of efforts to catch some of these reef fish.
Various fishing methods and gears are used for catching fish in the reef areas.
Common fishing methods include hand-lining, trolling, gill netting, scoop-net
fishing, rod fishing and spearfishing. The use of traditional fishing gears is
considered outdated and the use of modern fishing gears is now much more
preferred. Some of the currently known main uses of coastal reef resources
include:
Source of food for households
The marine reef resources provide the main source of food and especially protein
for more than 50% of the households in Tuvalu. This dependence is apparently
higher in the outer islands (59% - 95% of households) compared to Funafuti (just
over 50% of the households).
Special food items for social events
Shellfish stocks are not usually subsistence food. However, they are particularly
important food during festive seasons and for special occasions such as
weddings, funerals, birthday parties and government occasions.
Shellfish for handicrafts
While larger shells are collected for food, the cowries and other small species are
collected especially for the ornamental industry and for making handicraft. In the
2002 census, 137 women were reported as being economically active in the
production and selling of handicrafts. These handicrafts are targeted at tourists
and visitors. The very small number of tourists that usually visit Tuvalu puts a
12

2.3 Page 13

▲back to top
limit on this income earning activity. There is also a concern about the
sustainability of the collection of shellfish for this use.
Small scale commercial fishing
Small scale commercial fishing operations are a common feature on the islands
of Tuvalu. This is more attractive in Funafuti with the bigger local demand
compared to the outer islands.
Very little is known about the status of the reef fish stocks in Tuvalu. However
there is a general belief among residents that fish stocks are already in decline
especially in reef areas adjacent to villages with the increasing human population
perhaps as the main contributing factor to the problem. Given the significant
importance of coastal fisheries resources, the need for proper assessment to
develop practical management guidelines for the resource should be given high
priority.
2.3 Management Framework
Tuvalu has a nationwide open access system of resource ownership.
Traditionally, the Government has the power to control the overall fisheries. This
power is vested in the Minister responsible for Fisheries (Fisheries Ordinance
1990). Basically, the State owns everything up to, and including, the coastal
highest water mark and includes both all marine living resources (fish and
invertebrates) as well as non-living resources (minerals, sand, gravel, rubble,
rock etc.) below and above the seabed.
Regulations pertaining to matters related to the marine sector include the
Fisheries Act, the Local Government Act, and the Maritime Act which to date
have been ineffective in managing the marine resources, due to the lack of
resources in terms of capital and manpower. More recently several legal
instruments have given more power to the island communities to manage their
own resources. The 1997 Falekaupule Act, the Marine Resources Conservation
Area Act and the 2006 Marine Resources Act all give significant recognition to
the coastal fisheries resources and provide a stronger legal framework for its
management by the communities.
Nowadays, all resource management decisions regarding the entire coastal
zone/area of each island fall under the Island Council and the Falekaupule.
The Island Council is a body made up of members selected by and representing
the island communities, and is empowered by the national government as the
administrative authority with the legal power and responsibility for the
management of the coastal area in line with the welfare of the people. The Island
Council makes and administers by-laws and levy rates, and can also refer major
legal or administrative matters to the national government for advice or for
finalising decisions where decisions are hard to be made.
13

2.4 Page 14

▲back to top
The Falekaupule (assembly of elders) is comprised of all men in a community
over the age of 50 years old who regularly meet to discuss issues pertaining to
the welfare of the people. Under the Falekaupule Act, they have the power to
control and regulate fisheries activities within their area of jurisdiction (12 miles
off from shore). They are the body that endorses any by-laws or resolutions
proposed by the Island Council as stated under the 1997 Falekaupule Act, “…no
Town Council resolutions and by-laws can be passed without the consent of the
Falekaupule (Government of Tuvalu, 1995)…” but by-laws agreed upon by the
Falekaupule during their meetings (fono) can be immediately implemented and
enacted with the application of penalties on perpetrators, without the need of
gazetting. The new by-laws, after being legally scrutinized and if proven to
possess merits in the national interest, will be formulated into a bill which is
submitted for debate in parliament. If the bill is passed in parliament, it is then
gazetted and comes into force.
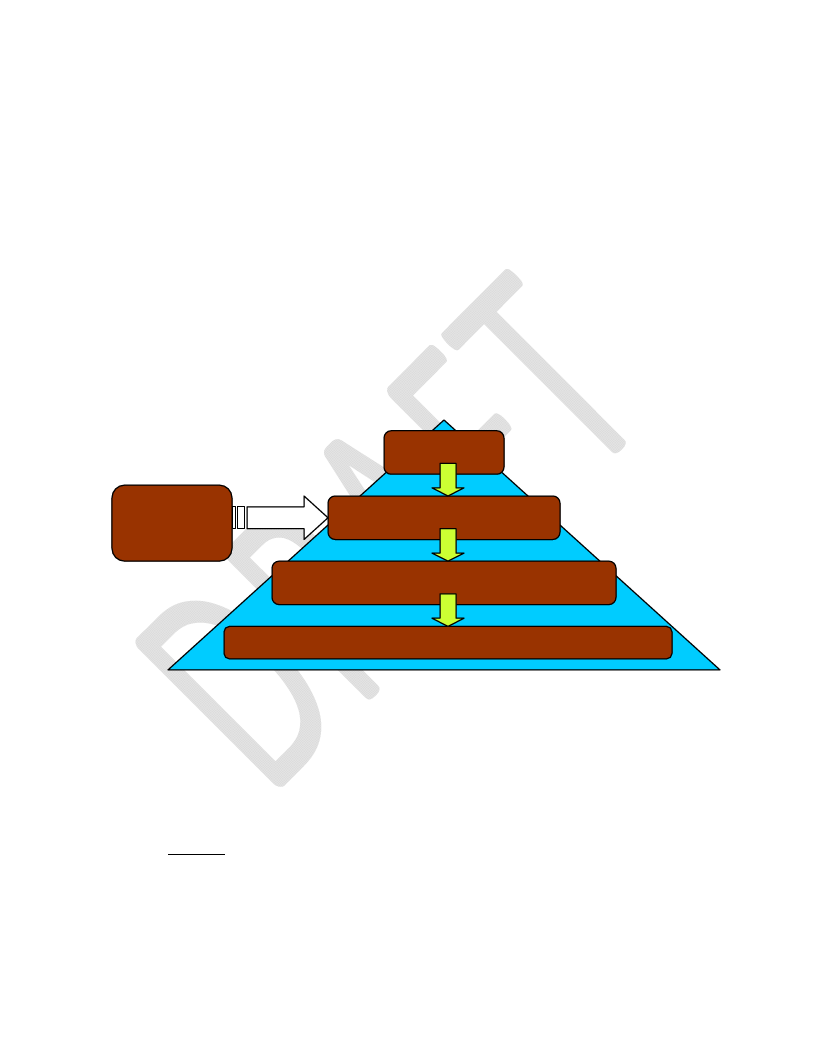
The
National
Government
Falekaupule
Kaupule
Island Community
Community Based & Civil Society Oganisations
Figure 1. Structure of Community Governance. The Falekaupule is the product of the fusion of
the traditional leadership and the introduced governing system and it functions as the decision
making body on the island. The Kaupule is the executive arm of the Falekaupule. The central
Government links directly to the Kaupule. (Adopted from Tuvalu NAPA Document).
3. Study Site
3.1 Funafuti Atoll
General
Funafuti Atoll is the capital of Tuvalu. It is the largest atoll in the country and has
a population of about 3962 which is the highest population in the country (see
also Section 2.1). Funafuti is also the main port and therefore is the gateway for
international travel and trade. Air Fiji provides two weekly flights between Nausori
and Funafuti. International shipping services for passengers and cargo are
14

2.5 Page 15

▲back to top
provided regularly by the government-owned vessel as well as by private
overseas shipping companies. An inter-island government-run ferry service
provides the only transportation link with the outer islands. Even as the main port,
and with more economic opportunities compared to the rest of the atolls in
Tuvalu, Funafuti currently still lacks any ongoing activities for foreign trade.
Topography
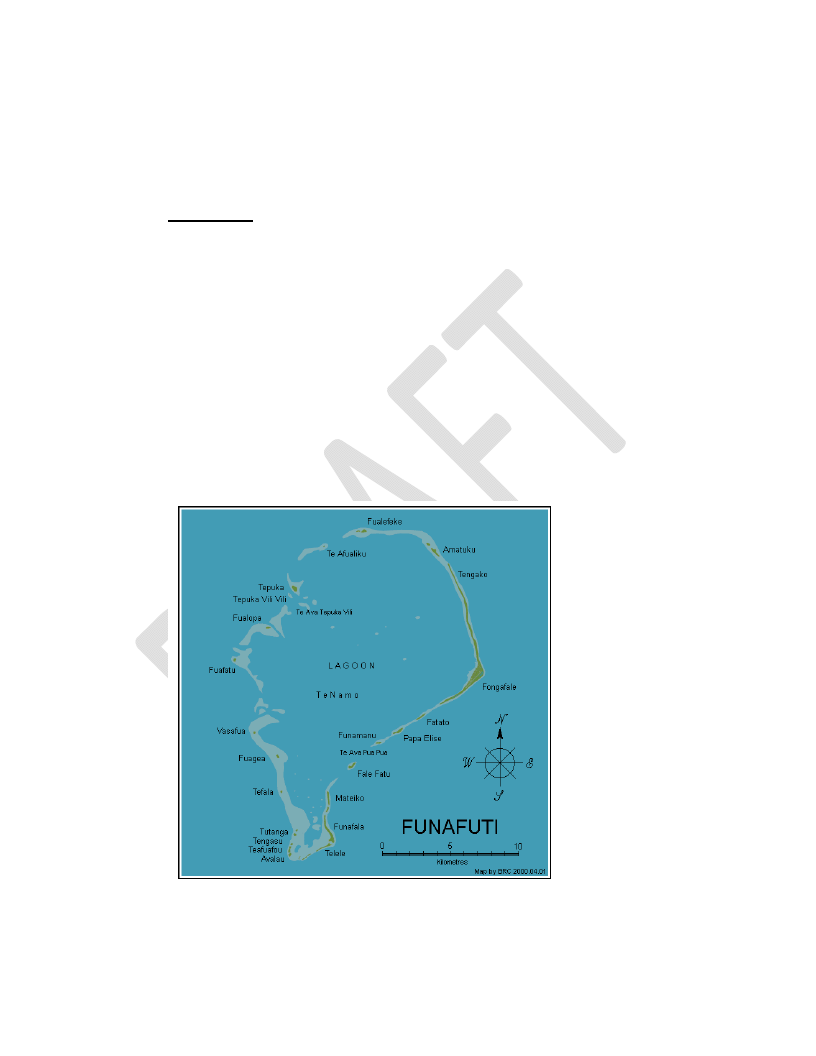
The atoll is only between 3-5 m above sea level but with quite a large reef and
lagoon areas (the largest for the country). The atoll is made up of a series of
submerged reef encircling a lagoon of about 205 km2 and 40-50 m deep. Mclean
& Hosking (1991) described the reef platform of 37 km2, to consist of bare reef
flats (92 %), vegetated islets (7 %) and adjacent beaches (1 %). The eastern side
of the atoll is comprised of well vegetated islets and is where the population of
the atoll is concentrated. On the western side of the atoll is a barrier reef
consisting of a few very small islets, traversed by deep passages, where the
GEF-funded national marine conservation area, established in 1996, is located.
The deepest passage is located on the south-east part of the atoll which is the
only one through which the big ships such as tourist cruise liners can pass and
enter into the lagoon. All the other numerous passages are only deep enough for
any other smaller ships (passenger, cargo and fishing) to pass through,
especially during high tides.
Figure 2. Map of Funafuti Atoll with its numerous islets and reef passages
15

2.6 Page 16

▲back to top
Fishing Activities
There are currently no formal commercial fishing and fisheries related operations
on Funafuti. The National Fishing Corporation of Tuvalu (Naficot) once tried a
deep bottom and outer reef fishing operation exporting to buyers in Fiji. The
operation was stopped because fish stocks were too low to meet the demand
and to make it economically sustainable. Also, there have been several small-
beche-de-mer operations on the island some years back. The entrepreneurs
hired local divers, and, using hookah gears, engaged in the collection of high
valued white-teat fish. The stocks were too low to sustain operations and this,
along with the big drop in market prices of beche-de-mer, the operations had to
close down.
In Funafuti, the demand for fish is high. To meet this local demand there are a
number of small scale local commercial fishing activities which undertake a
mixture of ocean fishing for tuna and reef fishing using mostly outboard powered
boats. A high percentage of households in Funafuti still consume fish that they
catch themselves. Most of this fishing is done by men but women and children
are quite often engaged in shallow water fishing and also in reef gleaning
activities to collect invertebrates such Anadara species, turbo and ornamental
seashells. The seashells are sold to the ornamental seashell trade which is the
biggest employer of women on Funafuti and the whole country.
Fish Consumption
On Funafuti, the average estimated per capita daily consumption of fish seemed
to have dropped in recent years from 0.9 kg per head per day reported by Sauni,
1997 (34% coverage) to 0.4 kg per head per day in 2005 (5% coverage, SPC,
2005). It is not known if the cause of the drop is due to less fish being available
or to the increased preference of the local people for imported sources of protein.
3.2 Marine Resource Management
As described in Section 2.3 above, like the rest of all the atolls in Tuvalu, the
management of marine resources in Funafuti is controlled and administered
under the powers of the Falekaupule and the Island Council through by-laws.
These new endorsed by-laws become as effective as any already existing
fisheries regulations established under the Fisheries Ordinance. The number of
existing related by-laws and fisheries regulations for Funafuti includes:
the ban of catching Selar crumenophthalmus (salala) fish (bye-law)
restriction of gillnet mesh-sizes (by-law)
indiscriminate harvesting of giant clams and beche-de-mer in
certain reef areas (by-law)
prohibition of the use of hookah and scuba gears for any form of
fishing (fisheries regulation)
use of dynamite and any form of fish poisons (fisheries regulation)
16

2.7 Page 17

▲back to top
Under the new Marine Resources Area Conservation Act, the Funafuti
Conservation Area was established in 1996. This is the only legal localized tapu
area in the country, covering approximately 33 square kilometers of protected
marine area which is a third of the entire Funafuti atoll, and includes six small
motus and about 20 percent of the total coral reef area of Funafuti lagoon. All
animals and plants in this area both on land and in the sea are protected. The
excavation of beach sand and gravels from this protected area is also prohibited.
In the present exercise, the importance of this existing legal framework is
recognized and any future efforts to develop and manage the marine aquarium
resources should consider and respect these legal instruments to avoid any
potential management conflicts in the future.
4. Objectives
The primary purpose of the study was to conduct an assessment of the marine
aquarium fish resources of Funafuti, i.e. to find out what species exist and if they
are in good enough numbers to support a marine aquarium fish trade.
The secondary aim is to collect the relevant information needed for a first and
quick assessment of the economical viability and feasibility of setting up a marine
aquarium trade in Funafuti. An assessment of the level of awareness about the
marine aquarium fish trade among the local community was also conducted in
order to identify the kind of information that is needed to improve basic
understanding about the trade, which would be valuable in the future should the
Government of Tuvalu choose to start a marine aquarium trade.
Most of the Pacific countries do not have local expertise to conduct resources
surveys so, as a side objective of this study, a training component was included
to address this issue and train at least 4 local divers, preferably from the
Fisheries Department, on the underwater visual census method that SPC have
been using in their reef fisheries resources assessment work. With this building
of local technical capacity to do surveys, it is then expected that the surveys can
be extended to the other atolls in Tuvalu and, over the long term, if marine
aquarium trade operations do start, then the Fisheries Department would have
the capacity to monitor the trade.
5. Methodology
5.1 Underwater visual census
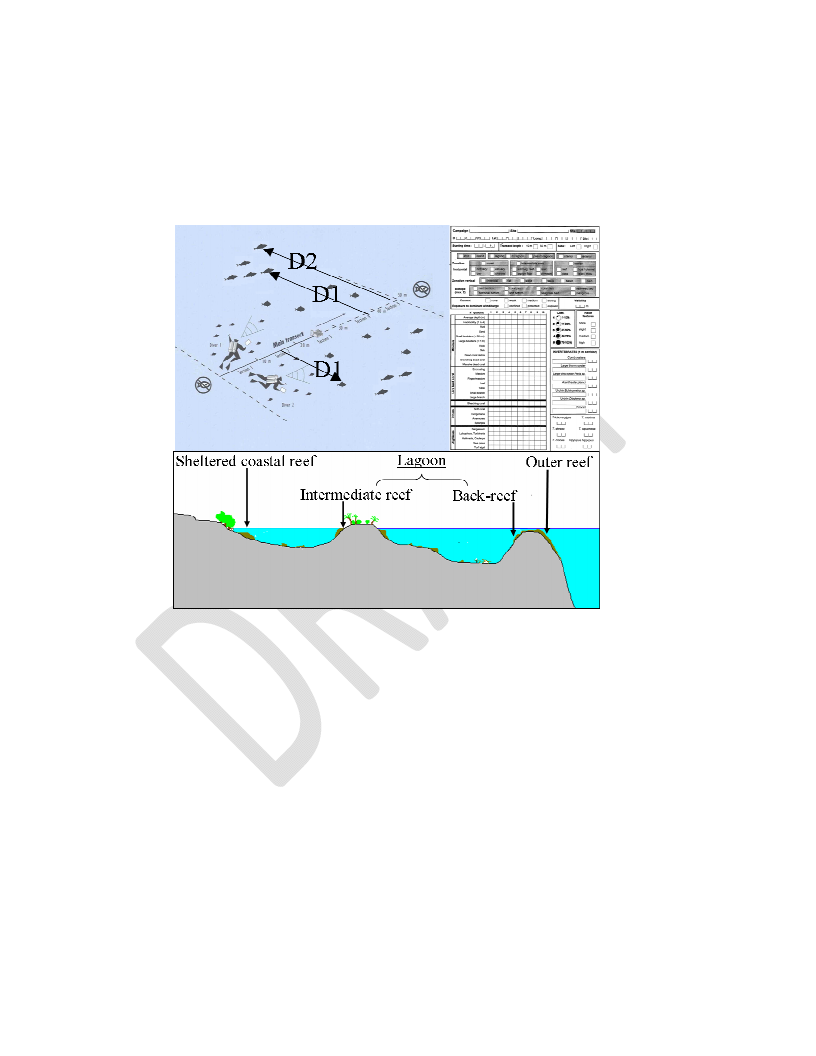
The distance-sampling underwater visual census (D-UVC) method (Kulbicki
and Sarramegna 1999, Kulbicki et al. 2000) was used to assess the marine
aquarium trade finfish resources in Funafuti Atoll. The D-UVC is fully described in
Labrosse et al. (2002). The transect consists of a 50 m line, represented on the
seafloor by an underwater tape (Fig. 2). Briefly, the method consists of recording
17

2.8 Page 18

▲back to top
the species name, abundance, body length and the distance to the transect line
for each fish or group of fish observed. Normally, for safety reasons, two divers
are required to conduct a survey, each diver counting fish on a different side of
the transect line. Mathematical models are then used to estimate fish density
(number of fish per unit area) and biomass (weight of fish per unit area) from the
counts.
Figure 3. Assessment of finfish resources and associated environments using distance-
sampling underwater visual censuses (D-UVC). Each diver recorded number of fish, fish size,
distance of fish to the transect line, and habitat quality, using pre-printed underwater paper.
5.2 Species Selection
Only reef fish of interest to the marine aquarium trade were surveyed. Since
Tuvalu does not have a marine aquarium trade yet and therefore there was no
existing list of local species of interest, a preliminary list of species was obtained
from the export invoices of nearby pacific countries of the most commonly
exported species. There are about 150 fish species from 20 families that are
commonly exported from the Pacific countries. These are listed in Table 1 below.
5.3 Substrate
Having some idea of the bottom substrate where the fish were counted is
important in order to be able to explain some of the environmental factors that
may influence the local abundance and distributions of fish species. A modified
version of the medium scale approach (MSA) similar to that developed and
18

2.9 Page 19

▲back to top
described by Clua et al. (2006) was used to record substrate characteristics
along transects where finfish were counted. Briefly, the method consists of
recording depth, habitat complexity, and 23 substrate parameters within ten 5x5
m quadrats located on each side of a 50-m transect, for a total of 20 quadrats per
transect (Fig. 2). The transect’s habitat characteristics are then calculated by
averaging substrate records over the 20 quadrats.
Table 1 List of species with potential for the marine aquarium trade
Family
Acanthuridae (surgeonfishes)
Balistidae (triggerfishes)
Blenniidae (blennies)
Callionymidae (dragonets)
Chaetodontidae (butterflyfishes)
Cirrhitidae (hawkfishes)
Ephippidae (batfishes)
Gobiidae (gobies)
Labridae (wrasses)
Microdesmidae (wormfishes and
dartfishes)
Monacanthidae (filefishes)
Mullidae (goatfishes)
Ostraciidae (trunkfishes)
Pomacanthidae (angelfishes)
Pomacentridae (damselfishes)
Pseudochromidae (dottybacks)
Ptereleotridae (dartfishes)
Scorpaenidae (scorpionfishes)
Serranidae (groupers, fairy
basslets and anthias)
Tetraodontidae (puffers)
Zanclidae (moorish idol)
Selected species
Acanthurus achilles, A. dussumieri, A. guttatus, A. lineatus, A. maculiceps, A.
mata, A. nigricans, A. nigrofuscus, A. nigroris, A. olivaceus, A. pyroferus, all
species of genus Ctenochaetus and Zebrasoma
Abalistes stellatus, Balistapus undulates, Balistoides conspicillum, all species of
genus Melichthys, Rhinecanthus and Sufflamen
All species
All species
All species
All species
All species
All species
All species of genus Anampses, Bodianus, Choerodon, Cirrhilabrus, Coris,
Halichoeres, Hemigymnus, Hologymnosus, Iniistius, Labroides, Labropsis,
Macropharyngodon, Oxycheilinus, Pseudocheilinus, Pseudojuloides, Stethojulis,
Thalassoma, Wetmorella, Epibulus insidiator, Gomphosus varius, Labrichthys
unilineatus and Novaculichthys taeniourus
All species
All species
Juveniles of genus Parupeneus
All species
All species
All species
All species
All species
All species of genus Pterois
All species of genus Luzonichthys, Pseudanthias, Juveniles of genus Variola and
Cephalopholis
All species
All species
5.4 Parameters of interest
Fish resources
In this report, the interest is to note the occurrence of the fish species that has
potential for the marine aquarium trade and to get an idea of how much of these
species are available. The following parameters are therefore noted:
biodiversity — the number of families, genera and species observed and
counted in D-UVC transects;
density (fish per m2) — estimated from fish abundance in D-UVC;
19

2.10 Page 20

▲back to top
size (cm fork length) — direct estimated record of fish size by D-UVC;
community structure — density and size compared among families;
stock size estimates — number of individuals per species estimated in
potentially known habitable reef areas.
The parameter size ratio (%) — the ratio between fish size and maximum
reported size of the species – could be used as an indicator for over fishing of a
species. This ratio can range from nearly zero when fish are very small (usually
the case when the bigger size fish have been removed by fishing) to nearly one
when fish has reached the greatest size reported for the species (unfished
population). The calculation of this parameter uses maximum reported size from
referenced sources for each species stored in the RFID database. This
parameter is not considered in this report but could be a useful one to consider in
future monitoring surveys.
Substrates
The bottom substrates are assessed at all sites in terms of several crucial
substrate parameters. These are obtained by grouping 23 primary substrate
parameters recorded by divers into 6 groups:
depth (m);
soft bottom (% cover) — sum of substrate components (1). mud
(sediment particles < 0.1 mm) and (2). sand and gravel (0.1 mm < hard
particles < 30 mm);
rubble and boulders (% cover) — sum of substrate components
(3). dead coral debris (carbonated structures of heterogeneous sizes,
broken and removed from their original locations), (4). small boulders
(diameter < 30 cm) and (5). large boulders (diameter < 1 m);
hard bottom (% cover) — sum of substrate components (6). slab and
pavement (flat hard substratum with no relief), rock (massive minerals)
and eroded dead coral (carbonated edifices that have lost their coral
colony shape), (7). dead coral (dead carbonated edifices that are still in
place and retain a general coral shape) and (8). bleaching coral;
live coral (% cover) — sum of substrate components (9). encrusting live
coral, (10). massive and sub-massive live corals, (11). digitate live
coral, (12). branching live coral, (13). foliose live coral, (14). tabulate
live coral and (15). Millepora spp.; and
soft coral (% cover) — substrate component (16). soft coral.
5.5 Survey Design
Coral reef ecosystems are complex and diverse. The NASA Millennium Coral
Reef Mapping Project (http://imars.marine.usf.edu/corals/index.html) has
20

3 Pages 21-30

▲back to top

3.1 Page 21

▲back to top
identified and classified coral reefs of the world in about 1000 categories.1 These
very detailed categories can be used directly to try to explain the status of living
resources or be lumped into more general categories to fit a study’s particular
needs. For the needs of the present marine aquarium finfish resource
assessment, reef types using the Millennium Project classification were grouped
into two main categories: – lagoon reefs, which includes the sheltered coastal
reefs, the intermediate reefs and the back reefs, and the outer reefs (Fig. 2). A
definition of the reef types is given below.
o lagoon reef — three sub categories
sheltered coastal reef — reef that fringes the land but is
located inside a lagoon or a pseudo-lagoon;
intermediate reef (patch reef that is located inside a lagoon
or a pseudo-lagoon) and
back reef (inner/lagoon side of outer reef); and
o outer reef — ocean side of fringing or barrier reefs.
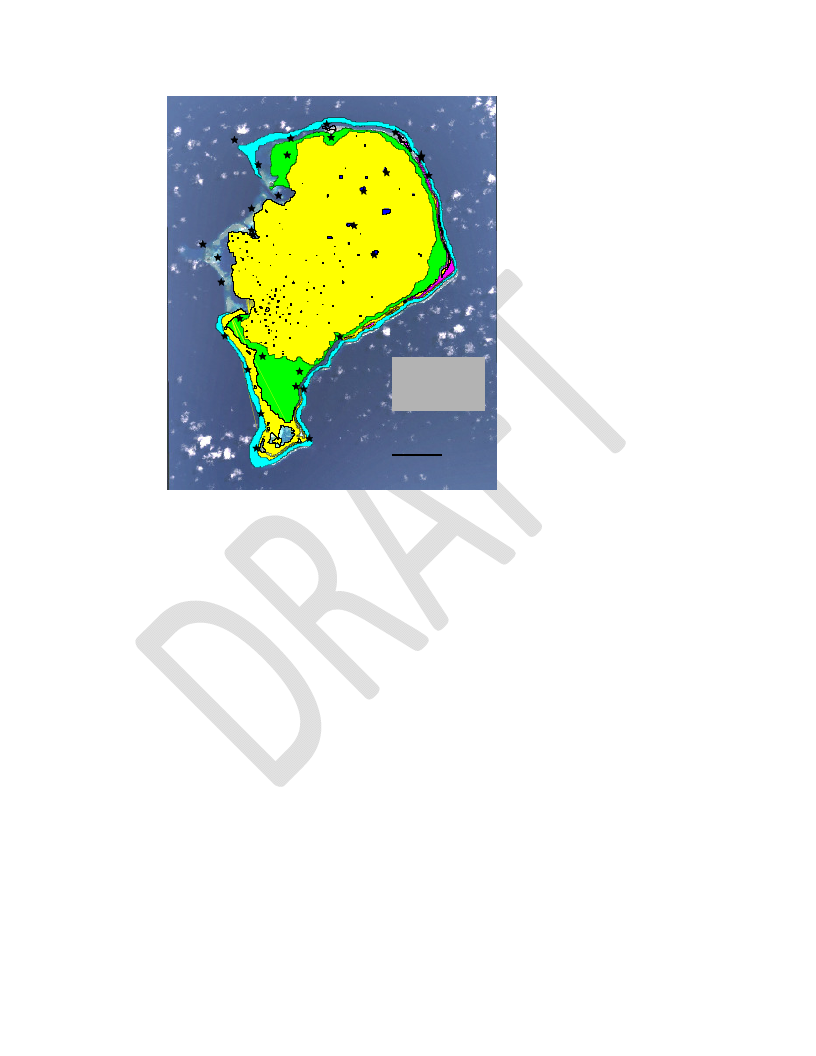
Fish and associated habitat parameters are recorded along 30 transects for the
whole atoll, with a balanced design of 15 transects on the lagoon reefs and 15
transects on the outer reefs. The exact position of transects are determined in
advance using satellite imagery, and actual positions are also marked using a
handheld Garmin GPS (Global Positioning System) 72, to maximize accuracy
and to allow repeatability for monitoring purposes.
5.6 Scaling
Maps from the Millennium Project allow the calculation of reef areas in the study
site, and those areas can be used to scale (using weighted averages) the
resource assessment at any spatial level. Technically, the weight given to each
transect corresponds to the ratio between the area of the reef structure on which
the transect was conducted (e.g. the area of sheltered coastal reef) and the
product of the total area of reef present (i.e. the area of sheltered coastal reef +
the area of intermediate reef, etc.) and the total number of transects performed
on the reef structure on which the transect was done.
1 Thanks to a collaboration with Dr Serge Andrefouet, IRD-Coreus Noumea and leader of the
Millenium Project, our study benefited in real time from the outputs of the ongoing Millenium
Project.
21

3.2 Page 22

▲back to top
TR11
TR14
TR04
TR15
North
TR05
TR16
TR06
TR17 TR08
TR07
TR13
TR03
TR12
TR10
TR30 TR09
TR29
TR31
TR32
TR18
TR28
TR19
TR25
TR27
TR20
TR24
TR26
TR21
TR22
TR23
Legend:
Land
Lagoon area
Coastal lagoon
Outer reef
|
|
Scale: 1 mile
Figure 4. Location of sampling stations on Funafuti Atoll
5.7 Training of local Fisheries Officers
One of the main aims of the SPC Regional Live Reef Fish Trade (LRFT) Initiative
is to try and address the problem of lack of technical capacity in the Pacific Island
member countries and territories to monitor and manage live reef fisheries both
for the Live Reef Food Fish (LRFF) and the aquarium trade (AT). The approach
taken by the Initiative is to use the country field surveys to train local fisheries
officers in the survey methods. A one week hands-on training is usually
conducted before the survey is done. The trained local fisheries officers are then
given the opportunity to participate and apply their newly acquired field survey
skills in the actual survey under the guidance of the SPC Live Reef Fisheries
Scientist.
Following the in-country survey, one of the trained local officers is given the
opportunity to go to the SPC headquarters and learn on how to process the
survey data using the SPC Reef Fisheries Observatory Interactive Database
(RFID). The data processing component also includes the analysis of the data,
interpretation and writing up the results into a technical report. For most countries
where a live reef fish trade already exists (LRFF or AT), this would also include
the drafting up of a management plan and a monitoring program for the particular
fisheries.
22

3.3 Page 23

▲back to top
From this capacity building program, it is expected that the trained local fisheries
officers would be able to carry out any required future assessment surveys in
new proposed sites and to conduct the monitoring of any ongoing live reef fish
activities.
The present technical report is the result of a survey conducted in Funafuti using
this approach.
6. Results
6.1 Species Numbers and Abundance
For the whole Funafuti survey, a total of 74 species from 12 families which have
potential for the marine aquarium trade were recorded. 58 species from 11
families were reported in the lagoon reef areas and 59 species from 11 families
were reported from the outer reefs. A complete list of species is appended but
the number of species recorded by family is given in Table 2 below.
It should be noted here that the number of species recorded does not reflect
species biodiversity but rather the number of species seen with potential for the
marine aquarium trade.
Table 2 Fish families and numbers of species recorded in the survey
FISH FAMILY:
Acanthuridae
Balistidae
Blennidae
Chaetodontidae
Cirrhitidae
Gobiidae
Labridae
Microdesmidae
Mullidae
Pomacanthidae
Pomacentridae
Zanclidae
No. of Species
Lagoon
Reefs
Outer
Reefs
4
3
2
3
1
0
15
19
1
1
1
1
16
15
0
2
1
1
4
4
12
9
1
1
The density of all the different species that were censured in the survey are given
in Appendix II. In terms of abundance, the family Pomacentridae (damselfishes)
was very well represented on the outer reefs with Pomacentrus vaiuli being the
23

3.4 Page 24

▲back to top
most abundant species with an average density of 48 individuals/1000 m2 of reef.
The other Pomacentrids with significant densities includes Pomacentrus pavo (38
inds/1000 m2), Chromis iomelas (23), Chromis margaritifer (22) and
Plectroglyphidodon johnstonianus (15). Among the Pomacanthids (angelfishes),
two species were quite common; Centropyge flavissimus with an average density
of 17 inds/1000 m2 of reef and C. loriculus with an average density of 8 inds/1000
m2 of reef.
On the lagoon reefs, again the Pomacentrids were very well represented but this
time with Chrysiptera cyanea being the most abundant species with an average
density of 166 inds/1000 m2 of reef. Pomacentrus pavo was also very common
with an average density of 117 inds/1000 m2 of reef. The most common
Chaetodon (butterflyfish) in the lagoon was Chaetodon trifascialis with an
average density of 19 inds/1000 m2 of reef. The most common Pomacanthid
(angelfish) was Centropyge flavissimus with an average density of 15 inds/1000
m2 of reef.
6.2 Species Size Distributions
Given that neither maximum size estimates specific for fish species of Funafuti or
Tuvalu, nor size estimates from previous surveys are available, it was only
possible to compare the fish sizes of fish surveyed with maximum size estimates
of the fish species obtained from Fishbase 2004. It should be noted here that
these maximum size estimates might be very different from the real maximum
sizes of fish species in Tuvalu and therefore should be treated with caution.
The mean sizes of fish species in the survey and associated size ratios i.e. ratio
of mean size to known maximum size, are tabulated in Appendix III. Looking at
the mean sizes of fish on the outer reefs of Funafuti, only 19% of the fish species
were larger than 50% of known maximum size. In the lagoon, however, a lot
more of the fish species recorded (i.e. 32%) were larger than 50% of the known
maximum size.
From this it will seem that most of the fish species in Tuvalu are generally much
smaller in size than the same species from other areas as reported in the
literature. In exploited fisheries situations, this would have been normally
associated to over fishing of the adult populations. However, given that these
particular species have not been exploited then this is very unlikely. Another
possible explanation might have to do with differences in habitat preference
between size groups (Helfman, 1978; Wener and Gilliam, 1984; Jones, 1988) or
just that fish in Tuvalu might be naturally smaller on average than those from
other places. All of these however would need to be verified further with more
work.
6.3 Stock Estimates
24

3.5 Page 25

▲back to top
Using the mean densities of the different species from the survey, it was possible
to get an estimate of the stock of each fish species in the two different reef
habitats, the lagoon reefs and the outer reefs, by simply multiplying the density of
each fish species for each habitat per 1000 m2 by the total area of lagoon reefs
and outer reefs respectively, as in Equation 1 below.
Species Density x Reef Area = Species Stock ………….Equation 1
(species density is the density of a species obtained from the UVC survey conducted in
a particular reef habitat and reef area is the estimated total area of that particular reef
habitat calculated using the reef classification and area estimates of Dr. Serge
Andrefouet from the Millennium Project).
The calculated stock estimates of each species in the different habitats are given
in Appendix IIA and the total combined stock estimate for the surveyed species
for Funafuti are given in Appendix IIB. From these tabulated stock estimates, it
can be seen that among the species in the lagoon Chrysiptera cyanea was the
most abundant, with an estimated lagoon stock of about 8.1 million individuals.
On the outer fringing reef, the Pomacentrus vaiuli was the most abundant, with a
stock estimate of 1.2 million individuals.
It should be stressed here that these calculated estimates of the stock of the
different species are first one-off estimates and assumes that fish are distributed
homogeneously and at the moment will not take into account for any temporal
and spatial variations in distributions. The calculated stock estimates will be
reviewed and improved through further repeated surveys.
In grouping the fish species into families, the stock estimates by fish family is
given in Table 3 below.
From Table 3 below, it is clear that the four most abundant groups includes
Pomacentrids with a total stock of about 24 million individuals, the most dominant
group, followed by Chaetodontids with 2.5 million, Pomacanthids with 2.2 million
and then Labridae with 1.9 million. Considering the general biology of these
family groups, being generally short lived, fast growing and therefore being quick
to mature, and including their reproductive strategies, being all year spawners or
daily spawners (as in the case of the Pomacanthids), with strong social and
territorial behaviour in spawning and in looking after their demersal eggs, these
are expected to favour successful recruitment and good support to the high
densities observed.
Table 3 Stock estimate by Family Group of Tuvalu Fish in the combined reef habitat
Family
Acanthuridae
Balistidae
Blenniidae
Nos.
Species
4
4
1
Stock
Estimate
568,680
141,360
111,067
StdErr_
Stock
330,857
87,892
79,366
25

3.6 Page 26

▲back to top
Chaetodontidae
Cirrhitidae
Gobiidae
Labridae
Microdesmidae
Mullidae
Pomacanthidae
Pomacentridae
Zanclidae
Total
21 2,451,440
960,941
1
67,253
51,902
1
59,120
47,279
20 1,929,267 1,134,216
1
34,267
27,898
1
154,013
108,141
5 2,204,493
772,692
13 23,998,943 14,042,804
1
57,293
27,892
73
Table 4 below gives stock estimates of the 10 most valuable species for the
marine aquarium trade. The most valuable among the 10 species, Pomacanthus
imperator, has the smallest standing stock of about 3,400 individuals.
Centropyge loriculus and C. flavissimus, which are two species with very high
demands, seemed to have good stocks (235,000 individuals and 1.2 million
individuals respectively). Pomacentrus vaiuli, with its very high abundance of 3.3
million individuals, could also become an important species. Given the lack of
information for giving estimates of sustainable yields, as a rule of thumb 10% of
the calculated stock estimates per year is considered conservative enough as a
start to allow the different fish species to be exploited in a sustainable manner. It
should be noted however, that, this first approximation should be refined through
a monitoring program every year.
Table 4 Estimated Stocks of 10 important marine aquarium trade species
Species
Pomacanthus imperator
Centropyge loriculus
Centropyge flavissimus
Labroides bicolor
Nemateleotris magnifica
Ctenochaetus strigosus
Gomphosus varius
Pomacentrus vaiuli
Plagiotremus laudandus
Thalassoma lunare
Stock
Estimates
3,427
235,480
1,177,200
450,800
30,840
396,253
231,640
3,278,533
111,067
225,560
StdErr_
Stock
3,427
83,484
303,229
229,890
24,471
182,765
102,644
1,144,037
79,366
135,070
10% of
Stock
343
23,548
117,720
45,080
3,084
39,625
23,164
327,853
11,107
22,556
6.4 Substrate and Habitat
General description
The bottom substrate of Funafuti Atoll has been described in other studies (Kaly,
1997). The assessment methods used in these studies were quite different and
therefore, although they could be used as indicators of the general status of coral
reefs, they would not provide a good basis for a detailed comparison. Similarly,
26

3.7 Page 27

▲back to top
just previous to this study, another study was conducted by the EU funded SPC
PROCFish project which utilizes a similar medium scale approach but using a
different habitat survey form and slightly different classification. The present
survey records bottom substrate using a landscape method which was
developed by the SPC Reef Fisheries Observatory (Vigliola, unpublished). The
method, basically assess the bottom substrate in 3 layers. The data from these
two recent surveys should provide similar results at the lower classification levels
and are more than likely to yield slightly different results at the higher levels of
habitat classification.
The results of the present survey are tabulated in Table 5 below. A total of 15
transects were assessed in both lagoon reef sites and outer reef sites. On each
transect, ten 5 m x 5 m quadrats were considered, thus covering 250 m2 of reef
area. This gives a total area of 3750 m2 each for the lagoon reef areas and the
outer reef areas which corresponds to 0.0096% of the total lagoon reef habitat
and 0.0146% of the total outer reef habitats respectively.
Table 5 Percentage cover of bottom substrates on Funafuti reefs
Transect/Habitat Details
Lagoon reefs2 Outer reef All reefs
Number of transects
Total habitat area (km2)
Depth (m)
Soft bottom (% cover)
Hard bottom (% cover)
Rubble & boulders (% cover)
Soft coral (% cover)
Dead Coral (% cover)
Live coral (% cover)
Bleaching coral
15
15
30
39
25.7
64.7
8 (3-14)
10 (3-20)
37.23 + 2.96
3.86 + 0.59
62.77 + 2.96
96.14 + 0.59
12.99 + 4.11
6.11 + 2.90
0.43 + 0.32
1.69 + 1.62
15.56 + 4.74
23.18 + 5.45
32.46 + 6.80
43.19 + 6.01
0.47 + 0.26
0.26 + 0.14
2 includes coastal sheltered reefs and back reefs
As given in Table 5, in the reef areas of the lagoon there is on average about
37% soft substrate (silt and sand) with the rest being hard substrates (hard
corals, slabs, rocks, rubble and boulders). On the outer reefs, there is much
lesser soft substrate (average of about 4%) with a predominant hard substrate
(average 96%). In the lagoon, much of the hard substrate was comprised of
abiotic substrates (51.5%, see Appendix V) whereas on the outer reefs this was
comprised mostly of hard corals (66.6%, see Appendix V).
Live Coral Cover
Looking at the status of corals in Funafuti, the live coral cover was higher on the
outer reefs (43%) than the lagoon reefs (33%). Dead standing intact corals were
also more common in the outer reefs (23%) compared to the lagoon reefs (16%).
Very little signs of bleaching were seen i.e. less than 0.5% in both habitats.
27

3.8 Page 28

▲back to top
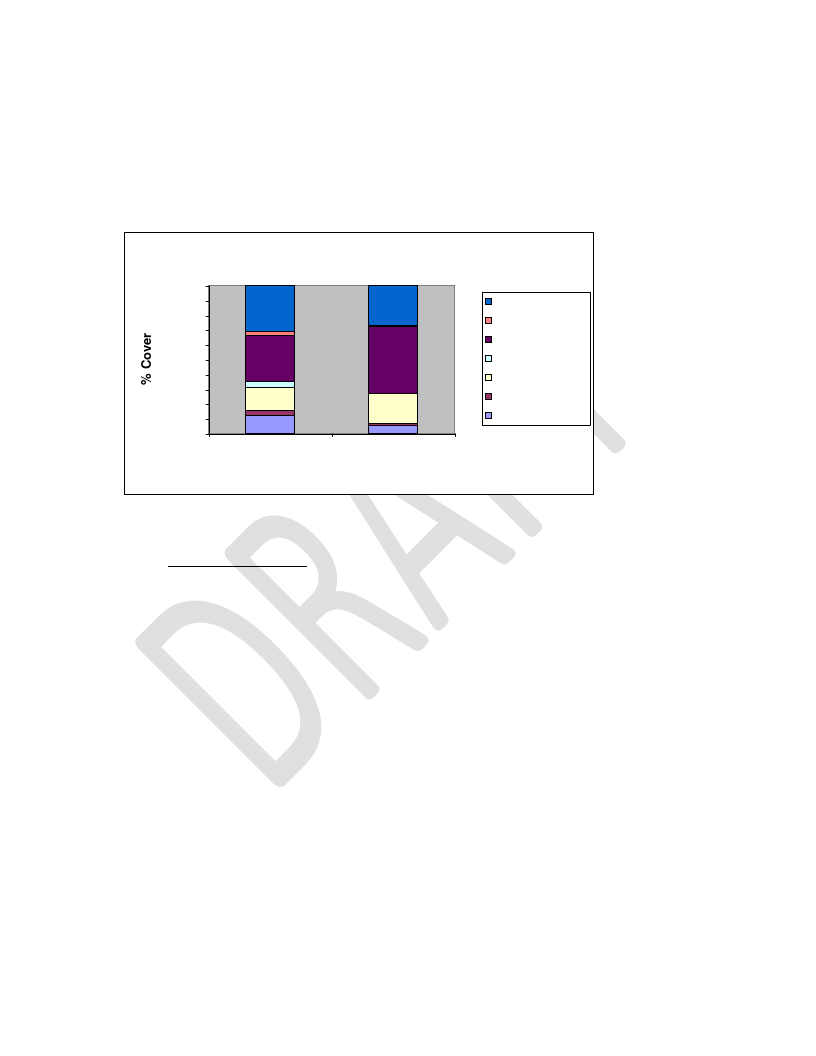
Figure 5 below shows the different proportions of live coral types in the outer
reefs and the lagoon reefs. The lagoon is comprised mainly of branching corals,
some tabulate corals and sub-massive corals. On the outer reef the branching
corals are also dominant but there are more tabulate and encrusting corals.
Compared to the lagoon reefs, the outer reefs seemed to host a lot more
massive, digitate and foliose corals.
Percentage of coral types
100%
90%
80%
70%
60%
50%
40%
30%
20%
10%
0%
Outer Reef
Lagoon
Habitats
Avg_Tabulate
Avg_Foliose
Avg_Branch
Avg_Digitate
Avg_Sub_Massive
Avg_Massive
Avg_Encrusting
Figure 5 Composition of live coral types in the two habitats
Other Observations
The percentage cover of other substrate types is tabulated in Appendix V. In
looking at the non-coralline bottom substrates, macro-algae seemed to be more
prominent in the lagoon compared to the reefs. This is especially true with the
calcareous algae (Halimeda sp.). No seagrass were seen in any of the survey
sites, neither in the lagoon nor in the outer reefs.
The presence of soft corals was very low in both habitats, with the lagoon having
an average cover of 0.43% and the outer reefs an average of 1.69%. Sponges
were similarly low in occurrence but were more common in the lagoon (3.70%)
than the outer reefs (1.76%).
7. Discussions and Recommendations
7.1 Potential of the Fish Resources for the Marine aquarium Trade
The results of the survey seemed to indicate that in Funafuti, there are at least 74
species that have potential for the marine aquarium trade. Given that no marine
aquarium trade operations have existed there in the past, then the stock estimate
from the survey provides a first baseline of the standing stock of the different
species. The stocks of some of these species especially, Pomacentrus vaiuli and
28

3.9 Page 29

▲back to top
Chrysiptera cyanea of the family Pomacentrids, are very abundant. The
Chaetodontids, the Pomacanthids and the Labrids are also quite abundant.
In considering the stocks of the 10 most valuable species among the species
recorded in the survey, it is clear that these selected species can support some
marine aquarium trade operations, even if only 10% of the stocks was allowed to
be harvested every year. It is however important to note here that should the
Tuvalu government decide to go ahead and develop the marine aquarium trade
industry in Funafuti, then the suggested 10% harvestable stock should only be
used as a basis to have a limit on the exploitation of the resource and a proper
monitoring program to monitor catch per unit effort and to collect biological
information should also be initiated. The 10% harvestable stock should also be
spread out over the year to dilute fishing pressure on the resources. Moreover, a
limit should be set on the number of exporting companies. These should all be
part of a management policy and plan which is necessary before operations are
allowed to start.
7.2 The Management Framework
Should the Tuvalu Government choose to go ahead with the development of the
marine aquarium trade in Funafuti, then it is very important that management
plan is developed and put in place. The management plan should take into
account all the administrative bodies that have some relation and legal authority
to all or any part of the coastal marine ecosystem. Evidently, the Fisheries
Department, the Environment Division, the Island Council, and the Falekaupule
working closely with the Attorney General’s Office would be no doubt form the
core group for a marine aquarium trade management and coordinating
committee. In the development of such a management plan, it is always
advisable to consult with the community to ensure that any concerns are
considered which will minimize the possibilities of future conflicts developing
once the marine aquarium trade starts.
As part of the management plan, there would also be a need to develop
management measures in the form of regulations, license conditions and fees, a
monitoring program, an effective enforcement mechanism and a sustainable
source of finance to support all these management activities.
7.3 The Infrastructure
Even though the resource might be available, this does not mean that a marine
aquarium trade will be feasible to develop. An important area that needs to be
carefully considered before deciding on this is the basic infrastructure required to
support this export industry. The most obvious factor is the availability of airline
connections from Funafuti to the market, including air cargo space available per
flight, air freight rates, the number of transits and connecting times between
flights.
29

3.10 Page 30

▲back to top
The availability of oxygen and packing materials and good source of electricity for
land facilities, including costs of these items, are also important considerations.
For the collection of marine organisms, one would need certified divers, good
diving gears, good source of air (compressors). All these would need to be
consistently available on the island and be in accordance with the required safety
and maintenance standards.
7.4 Future Requirements
The development of a successful marine aquarium trade industry would need
good consideration of the important factors and issues required to support such
an industry to make it economically feasible and sustainable. Advice and
assistance on undertaking such a venture can be provided through the SPC Live
Reef Fisheries Trade Initiative but would need to be formally requested through
the formal channel (Ministry of Foreign Affairs) if the Tuvalu Government wishes
to pursue this further.
The following steps provide a general guideline as to the kind of activities that will
still be required before full operations can start.
1. The Tuvalu Government reviews this report and decides if it wants to go
ahead with developing a marine aquarium trade or not.
2. If yes, then a formal request to SPC should be submitted indicating this
interest and the commitment to develop this industry.
3. A pilot study will be undertaken to assess the economic feasibility of such
a trade, which would include the whole process involved in such an
operation, from the catching of the fish right to the receipt of payment from
the overseas buyers. The study will look at both the economic and the
operational side to see the problems that would be encountered in the
whole process as well as the quality of the product when its gets to the
buyer. This study will also provide further information for making the final
decision if it will be worth getting into the trade, as well as information on
areas which can be improved to make operations more effective, including
location of market.
4. If the pilot study is a success, then a management plan and monitoring
program would need to be developed through a consultative process and
the management framework will be put in place.
5. Whilst the management plan is being developed, training can start for fish
catching, handling, husbandry procedures and packing for export.
6. Once the management plan and monitoring program is completed and
endorsed, then the operations can start. It is advisable that for the first
year only 2 marine aquarium trade licenses are awarded and that these be
monitored carefully. From the data collected from the monitoring, the
number of licenses to be awarded can then be refined.
30

4 Pages 31-40

▲back to top

4.1 Page 31

▲back to top
7. SPC will monitor the implementation of the management plan and the new
operations for the first year and will provide technical assistance and
advice when required.
8. Conclusions
The result of the survey indicates that a number of some important marine
aquarium trade species are present on Funafuti reefs. The abundance of these
species is adequate enough to set up a marine aquarium trade in Funafuti Atoll.
Five to ten of the most valuable species reported in the survey as listed in Table
4 would even be enough to support a small operation.
Even with this potential of the resources, there are a lot of other considerations
that the Tuvalu Government would need to look at before making any decisions
for operations to start. These considerations include logistical problems as well
as doing a cost/benefit analysis of having the trade.
If the Tuvalu Government decides to go ahead then it is very important to have a
properly designed plan to develop the trade. This should include two important
things to be taken up as the next immediate steps. These are:
1. A pilot study market trial to look at the economic feasibility of starting up
operations in Funafuti including the economics of exporting marine
aquarium trade products from Funafuti and at the same time
2. The development of a practical management framework, including a
management plan with regulations and a monitoring program, is
necessary before starting up operations.
Assistance to develop the industry, including the training of locals on
collection and handling procedures for the marine aquarium trade, can be
provided with assistance from the SPC LRFT Initiative but a formal request
would be required from the Tuvalu Government to SPC through the proper
channels.
31

4.2 Page 32

▲back to top
References
Clua, E., Legendre, P., Vigliola, L., Magron, F., Kulbicki, M., Sarramegna, S.,
Labrosse, P. and Galzin, R. (2006). Medium Scale Approach (MSA) for improved
assessment of coral reef fish habitat. J. Exp. Mar. Biol. Ecol 333. 219 – 230.
Fisheries Ordinance (1990). Government of Tuvalu.
Forum Secretariat (1999). Marine Ornamental Trade. Quality and Sustainability
for the Pacific Region. Pacific Island Forum Secretariat Trade and Investment
Division. Suva, Fiji. 73p.
Government of Tuvalu (2002). Population Census. Government of Tuvalu.
Holthus, P. (2001). Certification for Quality and Sustainability in the Collection,
Culture and Commerce of marine ornamentals. MAC NEWS 1st Quarter 2001.
Helfman, G. S. (1978). Patterns of community structure in fishes: Summary and
overview. Environ. Biol. Fishes 3, 129 – 148.
Jones, G. P. (1988). Experimental evaluation of the two effects of habitat
structure and competitive interactions on the juveniles of two coral reef fishes. J.
Exp. Mar. Biol. Ecol 123. 115 – 126.
Kulbicki, M. and Sarramegna, S. (1999). Comparison of density estimates from
strip transects and distance sampling from underwater visual censuses: a case
study of Chaetodontidae and Pomacanthidae. Aquat. Living Resour. 12 (5)
(1999): 315 – 325.
Kulbicki, M., Labrosse, P. and Letourneur, Y. (2000). Fish stock assessment of
the northern New Caledonian lagoons: 2 – Stocks of lagoon bottom and reef-
associated fishes. Aquat. Living Resour. 13 (2) (2002): 77 – 90.
Labrosse, P., Letourneur, Y., Kulbicki, M. and Paddon, J.R. (2002). Fish stock
assessment of the northern New Caledonian lagoons: 3 – Fishing pressure,
potential yields and impacts on management options. Aquat. Living Resour. 13
(2) (2002): 91 – 98.
Mclean, R.F. and Hosking, P.L., (1992). Tuvalu Lands Resource Survey,
Funafuti. Island Report No.7, Government of Tuvalu, 58pp.
Sauni, S. (1997). An assessment of fisheries statistics in Tuvalu: with specific
reference to Funafuti and Nukufetau Islands. Unpub, M.Sc dissertation.
University of Newcastle Upon Tyne, England.
32

4.3 Page 33

▲back to top
Sauni, S. and Apinelu, N. (2006). PROCFish-Coastal Component Finfish Survey
– Tuvalu: The state of coral reef fish resources in Funafuti Island, Tuvalu.
Unpublished report. 35p.
Kaly, U.L. (1997). Monitoring training and first survey of Funafuti Marine
Conservation Area, Tuvalu. Report 1. SPREP/Funafuti Town Council.
Werner, E. E. and Gilliam, J. F. (1984). The ontogenetic niche and species
interactions in size-structured populations. Annu. Rev. Ecil. Syst. 15, 393 – 425.
33

4.4 Page 34

▲back to top
Appendices
Appendix I: List of fish species surveyed and habitat location
FAMILY/
Species surveyed
Acanthuridae
Acanthurus nigricans
Acanthurus pyroferus
Ctenochaetus strigosus
Zebrasoma scopas
Balistidae
Balistapus undulatus
Melichthys vidua
Rhinecanthus aculeatus
Sufflamen bursa
Blenniidae
Plagiotremus laudandus
Chaetodontidae
Chaetodon auriga
Chaetodon citrinellus
Chaetodon ephippium
Chaetodon lineolatus
Chaetodon lunula
Chaetodon lunulatus
Chaetodon melannotus
Chaetodon meyeri
Chaetodon ornatissimus
Chaetodon pelewensis
Chaetodon rafflesii
Chaetodon reticulates
Chaetodon semeion
Chaetodon trifascialis
Chaetodon ulietensis
Chaetodon unimaculatus
Chaetodon vagabundus
Forcipiger flavissimus
Hemitaurichthys polylepis
Heniochus acuminatus
Heniochus chrysostomus
Cirrhitidae
Paracirrhites arcatus
Gobiidae
Valenciennea strigata
Labridae
Anampses meleagrides
Anampses twistii
Coris aygula
Coris gaimard
Epibulus insidiator
Gomphosus varius
Halichoeres hortulanus
Halichoeres margaritaceus
Halichoeres melanurus
Halichoeres trimaculatus
Labroides bicolor
Labroides dimidiatus
Labropsis sp.
Macropharyngodon meleagris
Stethojulis bandanensis
Outer
Reef
Lagoon
Reef
x
x
x
x
x
x
x
x
x
x
x
x
x
x
x
x
x
x
x
x
x
x
x
x
x
x
x
x
x
x
x
x
x
x
x
x
x
x
x
x
x
x
x
x
x
x
x
x
x
x
x
x
x
x
x
x
x
x
x
x
x
x
x
x
x
x
x
x
x
x
x
x
x
x
34

4.5 Page 35

▲back to top
Stethojulis strigiventer
Thalassoma hardwicke
Thalassoma lunare
Thalassoma purpureum
Thalassoma quinquevittatum
Microdesmidae
Nemateleotris magnifica
Ptereleotris evides
Mullidae
Parupeneus multifasciatus
Pomacanthidae
Centropyge bicolor
Centropyge flavissimus
Centropyge loriculus
Pomacanthus imperator
Pygoplites diacanthus
Pomacentridae
Amphiprion chrysopterus
Chromis iomelas
Chromis margaritifer
Chromis sp.
Chromis ternatensis
Chromis viridis
Chrysiptera cyanea
Dascyllus aruanus
Dascyllus reticulatus
Plectroglyphidodon johnstonianus
Pomacentrus bankanensis
Pomacentrus pavo
Pomacentrus vaiuli
Zanclidae
Zanclus cornutus
x
x
x
x
x
x
x
x
x
x
x
x
x
x
x
x
x
x
x
x
x
x
x
x
x
x
x
x
x
x
x
x
x
x
x
x
x
x
x
x
x
x
x
35

4.6 Page 36

▲back to top
Appendix IIA: Density and Stock Estimates of species surveyed by habitat
Habitat
Outer Fringing Reef
Outer Fringing Reef
Outer Fringing Reef
Outer Fringing Reef
Outer Fringing Reef
Outer Fringing Reef
Outer Fringing Reef
Outer Fringing Reef
Outer Fringing Reef
Outer Fringing Reef
Outer Fringing Reef
Outer Fringing Reef
Outer Fringing Reef
Outer Fringing Reef
Outer Fringing Reef
Outer Fringing Reef
Outer Fringing Reef
Outer Fringing Reef
Outer Fringing Reef
Outer Fringing Reef
Outer Fringing Reef
Outer Fringing Reef
Outer Fringing Reef
Outer Fringing Reef
Outer Fringing Reef
Outer Fringing Reef
Outer Fringing Reef
Outer Fringing Reef
Outer Fringing Reef
Family
Acanthuridae
Acanthuridae
Acanthuridae
Balistidae
Balistidae
Balistidae
Chaetodontidae
Chaetodontidae
Chaetodontidae
Chaetodontidae
Chaetodontidae
Chaetodontidae
Chaetodontidae
Chaetodontidae
Chaetodontidae
Chaetodontidae
Chaetodontidae
Chaetodontidae
Chaetodontidae
Chaetodontidae
Chaetodontidae
Chaetodontidae
Chaetodontidae
Chaetodontidae
Chaetodontidae
Cirrhitidae
Gobiidae
Labridae
Labridae
Species
Acanthurus pyroferus
Ctenochaetus strigosus
Zebrasoma scopas
Balistapus undulatus
Melichthys vidua
Sufflamen bursa
Chaetodon citrinellus
Chaetodon ephippium
Chaetodon lineolatus
Chaetodon lunula
Chaetodon lunulatus
Chaetodon melannotus
Chaetodon meyeri
Chaetodon ornatissimus
Chaetodon pelewensis
Chaetodon rafflesii
Chaetodon reticulatus
Chaetodon semeion
Chaetodon trifascialis
Chaetodon ulietensis
Chaetodon unimaculatus
Forcipiger flavissimus
Hemitaurichthys polylepis
Heniochus acuminatus
Heniochus chrysostomus
Paracirrhites arcatus
Valenciennea strigata
Anampses meleagrides
Anampses twistii
Density
/ m2
0.00187
0.00627
0.00027
0.00253
0.00053
0.00040
0.00040
0.00133
0.00093
0.00160
0.00053
0.00027
0.00013
0.00080
0.00307
0.00320
0.00707
0.00013
0.00747
0.00107
0.00027
0.00120
0.00360
0.00013
0.00067
0.00160
0.00027
0.00013
0.00013
Density
/1000 m2
1.86667
6.26667
0.26667
2.53333
0.53333
0.40000
0.40000
1.33333
0.93333
1.60000
0.53333
0.26667
0.13333
0.80000
3.06667
3.20000
7.06667
0.13333
7.46667
1.06667
0.26667
1.20000
3.60000
0.13333
0.66667
1.60000
0.26667
0.13333
0.13333
StdErr
Density
0.00149
0.00189
0.00018
0.00104
0.00031
0.00029
0.00029
0.00061
0.00058
0.00049
0.00053
0.00027
0.00013
0.00058
0.00114
0.00099
0.00279
0.00013
0.00196
0.00051
0.00027
0.00070
0.00252
0.00013
0.00067
0.00133
0.00027
0.00013
0.00013
Stock
Estimate
47973
161053
6853
65107
13707
10280
10280
34267
23987
41120
13707
6853
3427
20560
78813
82240
181613
3427
191893
27413
6853
30840
92520
3427
17133
41120
6853
3427
3427
10% of
Stock
4797
16105
685
6511
1371
1028
1028
3427
2399
4112
1371
685
343
2056
7881
8224
18161
343
19189
2741
685
3084
9252
343
1713
4112
685
343
343
36

4.7 Page 37

▲back to top
Outer Fringing Reef
Outer Fringing Reef
Outer Fringing Reef
Outer Fringing Reef
Outer Fringing Reef
Outer Fringing Reef
Outer Fringing Reef
Outer Fringing Reef
Outer Fringing Reef
Outer Fringing Reef
Outer Fringing Reef
Outer Fringing Reef
Outer Fringing Reef
Outer Fringing Reef
Outer Fringing Reef
Outer Fringing Reef
Outer Fringing Reef
Outer Fringing Reef
Outer Fringing Reef
Outer Fringing Reef
Outer Fringing Reef
Outer Fringing Reef
Outer Fringing Reef
Outer Fringing Reef
Outer Fringing Reef
Outer Fringing Reef
Outer Fringing Reef
Outer Fringing Reef
Outer Fringing Reef
Outer Fringing Reef
Lagoon Reef
Lagoon Reef
Lagoon Reef
Labridae
Labridae
Labridae
Labridae
Labridae
Labridae
Labridae
Labridae
Labridae
Labridae
Labridae
Labridae
Labridae
Microdesmidae
Microdesmidae
Mullidae
Pomacanthidae
Pomacanthidae
Pomacanthidae
Pomacanthidae
Pomacentridae
Pomacentridae
Pomacentridae
Pomacentridae
Pomacentridae
Pomacentridae
Pomacentridae
Pomacentridae
Pomacentridae
Zanclidae
Acanthuridae
Acanthuridae
Acanthuridae
Coris aygula
Coris gaimard
Gomphosus varius
Halichoeres hortulanus
Halichoeres margaritaceus
Halichoeres melanurus
Labroides bicolor
Labroides dimidiatus
Stethojulis bandanensis
Stethojulis strigiventer
Thalassoma lunare
Thalassoma purpureum
Thalassoma quinquevittatum
Nemateleotris magnifica
Ptereleotris evides
Parupeneus multifasciatus
Centropyge flavissimus
Centropyge loriculus
Pomacanthus imperator
Pygoplites diacanthus
Chromis iomelas
Chromis margaritifer
Chromis sp.
Chrysiptera cyanea
Dascyllus aruanus
Plectroglyphidodon johnstonianus
Pomacentrus bankanensis
Pomacentrus pavo
Pomacentrus vaiuli
Zanclus cornutus
Acanthurus nigricans
Acanthurus pyroferus
Ctenochaetus strigosus
0.00027
0.00027
0.00520
0.00280
0.00280
0.00013
0.00040
0.00347
0.00053
0.00093
0.00013
0.00280
0.00067
0.00120
0.00013
0.00040
0.01733
0.00840
0.00013
0.00093
0.02280
0.02222
0.00067
0.00960
0.00400
0.01440
0.00360
0.03773
0.04800
0.00147
0.00080
0.00067
0.00480
0.26667
0.26667
5.20000
2.80000
2.80000
0.13333
0.40000
3.46667
0.53333
0.93333
0.13333
2.80000
0.66667
1.20000
0.13333
0.40000
17.33333
8.40000
0.13333
0.93333
22.80000
22.22222
0.66667
9.60000
4.00000
14.40000
3.60000
37.73333
48.00000
1.46667
0.80000
0.66667
4.80000
0.00027
0.00027
0.00246
0.00125
0.00131
0.00013
0.00021
0.00124
0.00024
0.00064
0.00013
0.00158
0.00054
0.00095
0.00013
0.00029
0.00408
0.00249
0.00013
0.00043
0.00913
0.00899
0.00067
0.00960
0.00345
0.00981
0.00243
0.02343
0.02115
0.00053
0.00067
0.00054
0.00274
6853
6853
133640
71960
71960
3427
10280
89093
13707
23987
3427
71960
17133
30840
3427
10280
445467
215880
3427
23987
585960
571111
17133
246720
102800
370080
92520
969747
1233600
37693
39200
32667
235200
685
685
13364
7196
7196
343
1028
8909
1371
2399
343
7196
1713
3084
343
1028
44547
21588
343
2399
58596
57111
1713
24672
10280
37008
9252
96975
123360
3769
3920
3267
23520
37

4.8 Page 38

▲back to top
Lagoon Reef
Lagoon Reef
Lagoon Reef
Lagoon Reef
Lagoon Reef
Lagoon Reef
Lagoon Reef
Lagoon Reef
Lagoon Reef
Lagoon Reef
Lagoon Reef
Lagoon Reef
Lagoon Reef
Lagoon Reef
Lagoon Reef
Lagoon Reef
Lagoon Reef
Lagoon Reef
Lagoon Reef
Lagoon Reef
Lagoon Reef
Lagoon Reef
Lagoon Reef
Lagoon Reef
Lagoon Reef
Lagoon Reef
Lagoon Reef
Lagoon Reef
Lagoon Reef
Lagoon Reef
Lagoon Reef
Lagoon Reef
Lagoon Reef
Acanthuridae
Balistidae
Balistidae
Blenniidae
Chaetodontidae
Chaetodontidae
Chaetodontidae
Chaetodontidae
Chaetodontidae
Chaetodontidae
Chaetodontidae
Chaetodontidae
Chaetodontidae
Chaetodontidae
Chaetodontidae
Chaetodontidae
Chaetodontidae
Chaetodontidae
Chaetodontidae
Cirrhitidae
Gobiidae
Labridae
Labridae
Labridae
Labridae
Labridae
Labridae
Labridae
Labridae
Labridae
Labridae
Labridae
Labridae
Zebrasoma scopas
Balistapus undulatus
Rhinecanthus aculeatus
Plagiotremus laudandus
Chaetodon auriga
Chaetodon citrinellus
Chaetodon ephippium
Chaetodon lineolatus
Chaetodon lunula
Chaetodon lunulatus
Chaetodon ornatissimus
Chaetodon pelewensis
Chaetodon rafflesii
Chaetodon reticulatus
Chaetodon trifascialis
Chaetodon ulietensis
Chaetodon vagabundus
Forcipiger flavissimus
Heniochus chrysostomus
Paracirrhites arcatus
Valenciennea strigata
Anampses twistii
Epibulus insidiator
Gomphosus varius
Halichoeres hortulanus
Halichoeres margaritaceus
Halichoeres melanurus
Halichoeres trimaculatus
Labroides bicolor
Labroides dimidiatus
Labropsis sp.
Macropharyngodon meleagris
Stethojulis bandanensis
0.00093
0.00093
0.00013
0.00227
0.00133
0.00187
0.00213
0.00093
0.00040
0.00027
0.00040
0.00013
0.00200
0.00187
0.01853
0.00067
0.00107
0.00027
0.00040
0.00053
0.00107
0.00013
0.00013
0.00200
0.00280
0.00013
0.00027
0.00827
0.00187
0.00440
0.00013
0.00013
0.00120
0.93333
0.93333
0.13333
2.26667
1.33333
1.86667
2.13333
0.93333
0.40000
0.26667
0.40000
0.13333
2.00000
1.86667
18.53333
0.66667
1.06667
0.26667
0.40000
0.53333
1.06667
0.13333
0.13333
2.00000
2.80000
0.13333
0.26667
8.26667
1.86667
4.40000
0.13333
0.13333
1.20000
0.00093
0.00080
0.00013
0.00162
0.00054
0.00077
0.00093
0.00064
0.00029
0.00027
0.00029
0.00013
0.00085
0.00093
0.00421
0.00067
0.00061
0.00018
0.00029
0.00036
0.00083
0.00013
0.00013
0.00080
0.00143
0.00013
0.00027
0.00785
0.00072
0.00094
0.00013
0.00013
0.00061
45733
45733
6533
111067
65333
91467
104533
45733
19600
13067
19600
6533
98000
91467
908133
32667
52267
13067
19600
26133
52267
6533
6533
98000
137200
6533
13067
405067
91467
215600
6533
6533
58800
4573
4573
653
11107
6533
9147
10453
4573
1960
1307
1960
653
9800
9147
90813
3267
5227
1307
1960
2613
5227
653
653
9800
13720
653
1307
40507
9147
21560
653
653
5880
38

4.9 Page 39

▲back to top
Lagoon Reef
Lagoon Reef
Lagoon Reef
Lagoon Reef
Lagoon Reef
Lagoon Reef
Lagoon Reef
Lagoon Reef
Lagoon Reef
Lagoon Reef
Lagoon Reef
Lagoon Reef
Lagoon Reef
Lagoon Reef
Lagoon Reef
Lagoon Reef
Lagoon Reef
Lagoon Reef
Lagoon Reef
Lagoon Reef
Lagoon Reef
Lagoon Reef
Labridae
Labridae
Labridae
Labridae
Mullidae
Pomacanthidae
Pomacanthidae
Pomacanthidae
Pomacanthidae
Pomacentridae
Pomacentridae
Pomacentridae
Pomacentridae
Pomacentridae
Pomacentridae
Pomacentridae
Pomacentridae
Pomacentridae
Pomacentridae
Pomacentridae
Pomacentridae
Zanclidae
Stethojulis strigiventer
Thalassoma hardwicke
Thalassoma lunare
Thalassoma purpureum
Parupeneus multifasciatus
Centropyge bicolor
Centropyge flavissimus
Centropyge loriculus
Pygoplites diacanthus
Amphiprion chrysopterus
Chromis iomelas
Chromis margaritifer
Chromis ternatensis
Chromis viridis
Chrysiptera cyanea
Dascyllus aruanus
Dascyllus reticulatus
Plectroglyphidodon johnstonianus
Pomacentrus bankanensis
Pomacentrus pavo
Pomacentrus vaiuli
Zanclus cornutus
0.00107
0.00080
0.00453
0.00067
0.00293
0.00920
0.01493
0.00040
0.00640
0.00040
0.00133
0.00053
0.01867
0.05333
0.16560
0.00227
0.00027
0.00080
0.00213
0.11721
0.04173
0.00040
1.06667
0.80000
4.53333
0.66667
2.93333
9.20000
14.93333
0.40000
6.40000
0.40000
1.33333
0.53333
18.66667
53.33333
165.59680
2.26667
0.26667
0.80000
2.13333
117.20740
41.73333
0.40000
0.00051
0.00047
0.00269
0.00067
0.00206
0.00469
0.00405
0.00040
0.00289
0.00040
0.00108
0.00041
0.01867
0.02487
0.10812
0.00105
0.00027
0.00055
0.00213
0.07029
0.01226
0.00029
52267
39200
222133
32667
143733
450800
731733
19600
313600
19600
65333
26133
914667
2613333
8114243
111067
13067
39200
104533
5743163
2044933
19600
5227
3920
22213
3267
14373
45080
73173
1960
31360
1960
6533
2613
91467
261333
811424
11107
1307
3920
10453
574316
204493
1960
39

4.10 Page 40

▲back to top
Appendix IIB: Total Stock Estimates for each species for Funafuti Atoll
Family
Acanthuridae
Acanthuridae
Acanthuridae
Acanthuridae
Balistidae
Balistidae
Balistidae
Balistidae
Blenniidae
Chaetodontidae
Chaetodontidae
Chaetodontidae
Chaetodontidae
Chaetodontidae
Chaetodontidae
Chaetodontidae
Chaetodontidae
Chaetodontidae
Chaetodontidae
Chaetodontidae
Chaetodontidae
Chaetodontidae
Chaetodontidae
Chaetodontidae
Chaetodontidae
Chaetodontidae
Chaetodontidae
Chaetodontidae
Chaetodontidae
Species
Acanthurus nigricans
Acanthurus pyroferus
Ctenochaetus strigosus
Zebrasoma scopas
Balistapus undulatus
Melichthys vidua
Rhinecanthus aculeatus
Sufflamen bursa
Plagiotremus laudandus
Chaetodon auriga
Chaetodon citrinellus
Chaetodon ephippium
Chaetodon lineolatus
Chaetodon lunula
Chaetodon lunulatus
Chaetodon melannotus
Chaetodon meyeri
Chaetodon ornatissimus
Chaetodon pelewensis
Chaetodon rafflesii
Chaetodon reticulatus
Chaetodon semeion
Chaetodon trifascialis
Chaetodon ulietensis
Chaetodon unimaculatus
Chaetodon vagabundus
Forcipiger flavissimus
Hemitaurichthys polylepis
Heniochus acuminatus
Total stock
39200
80640
396253
52587
110840
13707
6533
10280
111067
65333
101747
138800
69720
60720
26773
6853
3427
40160
85347
180240
273080
3427
1100027
60080
6853
52267
43907
92520
3427
10% Total Stock
3920
8064
39625
5259
11084
1371
653
1028
11107
6533
10175
13880
6972
6072
2677
685
343
4016
8535
18024
27308
343
110003
6008
685
5227
4391
9252
343
40

5 Pages 41-50

▲back to top

5.1 Page 41

▲back to top
Cirrhitidae
Gobiidae
Labridae
Labridae
Labridae
Labridae
Labridae
Labridae
Labridae
Labridae
Labridae
Labridae
Labridae
Labridae
Labridae
Labridae
Labridae
Labridae
Labridae
Labridae
Labridae
Labridae
Microdesmidae
Microdesmidae
Mullidae
Pomacanthidae
Pomacanthidae
Pomacanthidae
Pomacanthidae
Pomacanthidae
Pomacentridae
Pomacentridae
Pomacentridae
Heniochus chrysostomus
Paracirrhites arcatus
Valenciennea strigata
Anampses meleagrides
Anampses twistii
Coris aygula
Coris gaimard
Epibulus insidiator
Gomphosus varius
Halichoeres hortulanus
Halichoeres margaritaceus
Halichoeres melanurus
Halichoeres trimaculatus
Labroides bicolor
Labroides dimidiatus
Labropsis sp.
Stethojulis bandanensis
Stethojulis strigiventer
Thalassoma hardwicke
Thalassoma lunare
Thalassoma purpureum
Thalassoma quinquevittatum
Nemateleotris magnifica
Ptereleotris evides
Parupeneus multifasciatus
Centropyge bicolor
Centropyge flavissimus
Centropyge loriculus
Pomacanthus imperator
Pygoplites diacanthus
Amphiprion chrysopterus
Chromis iomelas
Chromis margaritifer
36733
67253
59120
3427
9960
6853
6853
6533
231640
209160
78493
16493
405067
101747
304693
6533
72507
76253
39200
225560
104627
17133
30840
3427
154013
450800
1177200
235480
3427
337587
19600
651293
597244
41
3673
6725
5912
343
996
685
685
653
23164
20916
7849
1649
40507
10175
30469
653
7251
7625
3920
22556
10463
1713
3084
343
15401
89627
94761
2303
2399
89956
59071
8247
27285

5.2 Page 42

▲back to top
Pomacentridae
Pomacentridae
Pomacentridae
Pomacentridae
Pomacentridae
Pomacentridae
Pomacentridae
Pomacentridae
Pomacentridae
Pomacentridae
Zanclidae
Chromis sp.
Chromis ternatensis
Chromis viridis
Chrysiptera cyanea
Dascyllus aruanus
Dascyllus reticulatus
Plectroglyphidodon johnstonianus
Pomacentrus bankanensis
Pomacentrus pavo
Pomacentrus vaiuli
Zanclus cornutus
17133
914667
2613333
8360963
213867
13067
409280
197053
6712909
3278533
57293
10280
128475
270585
908399
134467
1307
7689
10453
574316
204493
1960
42

5.3 Page 43

▲back to top
Appendix III: Species Mean Sizes and calculated Size Ratio to known maximum length (where available)
Habitat
Outer Reefs
Outer Reefs
Outer Reefs
Outer Reefs
Outer Reefs
Outer Reefs
Outer Reefs
Outer Reefs
Outer Reefs
Outer Reefs
Outer Reefs
Outer Reefs
Outer Reefs
Outer Reefs
Outer Reefs
Outer Reefs
Outer Reefs
Outer Reefs
Outer Reefs
Outer Reefs
Outer Reefs
Outer Reefs
Outer Reefs
Outer Reefs
Outer Reefs
Outer Reefs
Outer Reefs
Outer Reefs
Outer Reefs
Outer Reefs
Species
Acanthurus pyroferus
Ctenochaetus strigosus
Zebrasoma scopas
Balistapus undulatus
Melichthys vidua
Sufflamen bursa
Chaetodon citrinellus
Chaetodon ephippium
Chaetodon lineolatus
Chaetodon lunula
Chaetodon lunulatus
Chaetodon melannotus
Chaetodon meyeri
Chaetodon ornatissimus
Chaetodon pelewensis
Chaetodon rafflesii
Chaetodon reticulatus
Chaetodon semeion
Chaetodon trifascialis
Chaetodon ulietensis
Chaetodon unimaculatus
Forcipiger flavissimus
Hemitaurichthys polylepis
Heniochus acuminatus
Heniochus chrysostomus
Paracirrhites arcatus
Valenciennea strigata
Anampses meleagrides
Anampses twistii
Coris aygula
Mean
Size (cm)
3.64
2.06
4.50
7.58
9.50
9.00
4.00
7.50
9.71
8.17
8.00
5.00
11.00
11.67
5.74
7.46
6.66
18.00
7.57
7.75
4.00
9.56
8.78
20.00
3.00
4.75
2.00
6.00
8.00
7.00
Std.Err_
MeanSize
1.29
0.32
3.18
1.52
3.88
4.50
2.00
2.50
4.34
2.58
5.66
5.00
7.78
5.83
1.43
1.56
1.05
12.73
0.94
3.16
4.00
3.61
2.53
20.00
3.00
1.50
2.00
4.24
8.00
4.04
Size
Ratio
0.15
0.11
0.23
0.25
0.27
0.38
0.31
0.33
0.32
0.41
0.53
0.33
0.61
0.61
0.46
0.50
0.42
0.78
0.42
0.52
0.20
0.43
0.49
0.80
0.19
Std.Err_
SizeRatio
0.05
0.02
0.16
0.05
0.11
0.19
0.15
0.11
0.14
0.13
0.38
0.33
0.43
0.31
0.11
0.10
0.07
0.55
0.05
0.21
0.20
0.16
0.14
0.80
0.19
0.27
0.19
0.07
0.04
43

5.4 Page 44

▲back to top
Outer Reefs
Outer Reefs
Outer Reefs
Outer Reefs
Outer Reefs
Outer Reefs
Outer Reefs
Outer Reefs
Outer Reefs
Outer Reefs
Outer Reefs
Outer Reefs
Outer Reefs
Outer Reefs
Outer Reefs
Outer Reefs
Outer Reefs
Outer Reefs
Outer Reefs
Outer Reefs
Outer Reefs
Outer Reefs
Outer Reefs
Outer Reefs
Outer Reefs
Outer Reefs
Outer Reefs
Outer Reefs
Outer Reefs
Lagoon Reefs
Lagoon Reefs
Lagoon Reefs
Lagoon Reefs
Coris gaimard
Gomphosus varius
Halichoeres hortulanus
Halichoeres margaritaceus
Halichoeres melanurus
Labroides bicolor
Labroides dimidiatus
Stethojulis bandanensis
Stethojulis strigiventer
Thalassoma lunare
Thalassoma purpureum
Thalassoma quinquevittatum
Nemateleotris magnifica
Ptereleotris evides
Parupeneus multifasciatus
Centropyge flavissimus
Centropyge loriculus
Pomacanthus imperator
Pygoplites diacanthus
Chromis iomelas
Chromis margaritifer
Chromis sp.
Chrysiptera cyanea
Dascyllus aruanus
Plectroglyphidodon
johnstonianus
Pomacentrus bankanensis
Pomacentrus pavo
Pomacentrus vaiuli
Zanclus cornutus
Acanthurus nigricans
Acanthurus pyroferus
Ctenochaetus strigosus
Zebrasoma scopas
7.50
5.72
7.48
5.76
5.00
5.33
4.00
5.00
5.71
4.00
6.90
5.80
5.56
6.00
5.00
4.24
3.86
10.00
9.57
2.98
2.77
3.40
2.00
2.43
4.58
2.48
2.27
2.65
10.27
3.83
8.60
2.94
6.00
3.75
0.19
0.09
0.98
0.20
0.04
1.72
0.28
0.06
1.44
5.00
2.67
0.89
2.50
2.56
4.00
1.73
2.90
2.48
6.00
2.89
0.17
0.10
0.32
0.30
0.02
0.50
0.39
0.05
10.00
0.26
0.26
3.91
0.37
0.15
0.49
0.51
1.96
1.00
0.81
0.72
0.83
0.44
0.36
2.75
0.64
0.17
2.21
0.18
0.10
4.97
0.34
0.20
0.52
0.16
0.03
4.24
0.30
0.21
44

5.5 Page 45

▲back to top
Lagoon Reefs
Lagoon Reefs
Lagoon Reefs
Lagoon Reefs
Lagoon Reefs
Lagoon Reefs
Lagoon Reefs
Lagoon Reefs
Lagoon Reefs
Lagoon Reefs
Lagoon Reefs
Lagoon Reefs
Lagoon Reefs
Lagoon Reefs
Lagoon Reefs
Lagoon Reefs
Lagoon Reefs
Lagoon Reefs
Lagoon Reefs
Lagoon Reefs
Lagoon Reefs
Lagoon Reefs
Lagoon Reefs
Lagoon Reefs
Lagoon Reefs
Lagoon Reefs
Lagoon Reefs
Lagoon Reefs
Lagoon Reefs
Lagoon Reefs
Lagoon Reefs
Lagoon Reefs
Lagoon Reefs
Balistapus undulatus
Rhinecanthus aculeatus
Plagiotremus laudandus
Chaetodon auriga
Chaetodon citrinellus
Chaetodon ephippium
Chaetodon lineolatus
Chaetodon lunula
Chaetodon lunulatus
Chaetodon ornatissimus
Chaetodon pelewensis
Chaetodon rafflesii
Chaetodon reticulatus
Chaetodon trifascialis
Chaetodon ulietensis
Chaetodon vagabundus
Forcipiger flavissimus
Heniochus chrysostomus
Paracirrhites arcatus
Valenciennea strigata
Anampses twistii
Epibulus insidiator
Gomphosus varius
Halichoeres hortulanus
Halichoeres margaritaceus
Halichoeres melanurus
Halichoeres trimaculatus
Labroides bicolor
Labroides dimidiatus
Labropsis sp.
Macropharyngodon meleagris
Stethojulis bandanensis
Stethojulis strigiventer
7.29
5.65
11.60
7.14
9.63
10.14
14.00
8.00
8.00
5.00
8.67
8.71
8.42
10.80
9.25
6.00
14.00
4.25
4.88
6.00
24.00
7.53
6.33
6.00
5.00
5.87
5.21
4.15
5.00
3.00
5.00
5.13
2.75
0.24
0.09
2.53
3.87
0.58
0.19
2.53
0.55
0.19
2.57
0.42
0.11
5.86
0.34
0.20
8.08
0.70
0.40
8.00
0.53
0.53
5.66
0.42
0.30
5.00
0.40
0.40
2.61
0.58
0.17
2.76
0.54
0.17
0.79
0.47
0.04
6.24
0.72
0.42
4.14
0.40
0.18
3.46
0.27
0.16
8.08
0.88
0.51
2.45
2.18
6.00
16.97
0.69
0.48
2.09
0.27
0.07
1.45
0.23
0.05
6.00
3.54
1.20
1.35
0.85
5.00
3.00
2.04
2.29
45

5.6 Page 46

▲back to top
Lagoon Reefs
Lagoon Reefs
Lagoon Reefs
Lagoon Reefs
Lagoon Reefs
Lagoon Reefs
Lagoon Reefs
Lagoon Reefs
Lagoon Reefs
Lagoon Reefs
Lagoon Reefs
Lagoon Reefs
Lagoon Reefs
Lagoon Reefs
Lagoon Reefs
Lagoon Reefs
Lagoon Reefs
Lagoon Reefs
Lagoon Reefs
Lagoon Reefs
Lagoon Reefs
Thalassoma hardwicke
Thalassoma lunare
Thalassoma purpureum
Parupeneus multifasciatus
Centropyge bicolor
Centropyge flavissimus
Centropyge loriculus
Pygoplites diacanthus
Amphiprion chrysopterus
Chromis iomelas
Chromis margaritifer
Chromis ternatensis
Chromis viridis
Chrysiptera cyanea
Dascyllus aruanus
Dascyllus reticulatus
Plectroglyphidodon
johnstonianus
Pomacentrus bankanensis
Pomacentrus pavo
Pomacentrus vaiuli
Zanclus cornutus
4.83
5.79
5.20
6.95
5.10
4.32
4.33
11.33
3.33
2.80
3.50
4.14
1.67
2.45
1.88
4.00
4.83
5.31
2.66
2.85
12.67
2.42
1.37
2.60
2.20
0.23
0.07
0.76
0.34
0.05
0.44
0.31
0.03
3.06
0.43
0.31
1.75
0.44
0.07
1.92
1.62
2.02
2.39
0.42
0.40
0.71
4.00
2.42
1.77
0.38
0.28
6.33
0.79
0.40
46

5.7 Page 47

▲back to top
Appendix IV:
List of Funafuti transect stations and positions
Country
Tuvalu
Tuvalu
Tuvalu
Tuvalu
Tuvalu
Tuvalu
Tuvalu
Tuvalu
Tuvalu
Tuvalu
Tuvalu
Tuvalu
Tuvalu
Tuvalu
Tuvalu
Tuvalu
Tuvalu
Tuvalu
Tuvalu
Tuvalu
Tuvalu
Tuvalu
Tuvalu
Tuvalu
Tuvalu
Tuvalu
Tuvalu
Tuvalu
Tuvalu
Tuvalu
Site
Funafuti Aquarium
Funafuti Aquarium
Funafuti Aquarium
Funafuti Aquarium
Funafuti Aquarium
Funafuti Aquarium
Funafuti Aquarium
Funafuti Aquarium
Funafuti Aquarium
Funafuti Aquarium
Funafuti Aquarium
Funafuti Aquarium
Funafuti Aquarium
Funafuti Aquarium
Funafuti Aquarium
Funafuti Aquarium
Funafuti Aquarium
Funafuti Aquarium
Funafuti Aquarium
Funafuti Aquarium
Funafuti Aquarium
Funafuti Aquarium
Funafuti Aquarium
Funafuti Aquarium
Funafuti Aquarium
Funafuti Aquarium
Funafuti Aquarium
Funafuti Aquarium
Funafuti Aquarium
Funafuti Aquarium
Stn_Name
TR09
TR10
TR11
TR12
TR13
TR14
TR15
TR16
TR17
TR18
TR19
TR20
TR21
TR22
TR23
TR03
TR04
TR05
TR06
TR07
TR08
TR24
TR25
TR26
TR27
TR28
TR29
TR30
TR31
TR32
Habitat
coastal.back
coastal.back
coastal.back
coastal.back
coastal.back
coastal.back
coastal.back
coastal.back
coastal.back
coastal.back
coastal.back
coastal.back
coastal.back
coastal.back
coastal.back
lagoon.lagoon
lagoon.lagoon
lagoon.lagoon
lagoon.lagoon
lagoon.lagoon
lagoon.lagoon
lagoon.lagoon
lagoon.lagoon
lagoon.lagoon
lagoon.lagoon
lagoon.lagoon
lagoon.lagoon
lagoon.lagoon
lagoon.lagoon
lagoon.lagoon
Latitude
8°27'28.3788" S
8°26'50.7012" S
8°26'05.1612" S
8°25'39.0612" S
8°25'26.8788" S
8°26'00.1212" S
8°27'01.7388" S
8°28'29.82" S
8°30'11.0412" S
8°31'40.1988" S
8°33'47.0988" S
8°35'07.8612" S
8°36'52.92" S
8°38'12.66" S
8°37'51.24" S
8°25'57.4212" S
8°26'40.1388" S
8°28'14.8188" S
8°29'47.5188" S
8°30'42.2388" S E
8°29'47.5188" S
8°35'54.24" S
8°33'50.8212" S E
8°35'48.2388" S
8°34'35.4612" S
8°33'06.48" S
8°28'06.1212" S
8°27'22.14" S
8°29'26.2212" S
8°30'35.9388" S
Longitude
179°11'07.1988" E
179°10'47.9388" E
179°03'19.9188" E
179°09'40.2588" E
179°07'02.82" E
179°05'34.3788" E
179°04'17.22" E
179°40'04.08" E
179°02'04.3188" E
179°02'47.6988" E
179°02'57.5988" E
179°03'51.48" E
179°04'24.3588" E
179°04'13.26" E
179°06'18.7812" E
179°07'12.18" E
179°05'26.4012" E
179°05'05.1612" E
179°04'03.9" E
179°02'39.4188"
179°04'03.9" E
179°06'07.6788" E
179°07'32.7"
179°05'47.4" E
179°04'27.1812" E
179°03'31.68" E
179°08'29.58" E
179°09'26.1" E
179°08'06.36" E
179°08'55.7412" E
47

5.8 Page 48

▲back to top
Appendix V: Average bottom features for the two different habitats
Habitat
Depth_Transect
Depth_Crest
Depth_Floor
Line_Of_Sight_Visibility
Topography
Complexity
Lagoon
7.83 m
4.53 m
14.33 m
20.60 m
1.8
2.27
Std. Error
+ 0.44
+ 1.90
+ 0.24
+ 0.23
Outer Reef
9.65 m
4.60 m
16.07 m
22.41m
2.27
2.8
Hard_Substrate
Soft_Substrate
62.77
37.23
+ 8.93
+ 8.93
96.14
3.86
Abiotic
Hard_Corals
51.51
48.49
+ 6.94
+ 6.94
33.37
66.63
Slab
Silt
Mud
Sand
Rubbles
Small_Boulders
Large_Boulders
Rock
12.57
2.07
0.00
20.75
5.77
4.87
2.36
3.12
+ 4.41
+ 1.12
+ 0.00
+ 5.91
+ 1.88
+ 1.58
+ 0.95
+ 1.30
23.45
0.13
0.00
0.89
3.11
1.21
1.79
2.79
Live_Coral
Bleaching_Coral
Dead_Coral_In_Place
32.46
15.57
0.47
+ 6.80
+ 4.74
+ 0.26
43.20
23.18
0.26
Encrusting
Massive
Sub_Massive
Digitate
Branch
Foliose
Tabulate
2.47
0.84
9.65
0.23
22.03
0.08
13.19
+ 0.63
+ 0.33
+ 3.74
+ 0.17
+ 5.46
+ 0.08
+ 2.64
8.30
1.85
10.77
2.52
20.69
1.69
20.82
Sponges
Soft_Coral
Macro_Algae
Turf
Calcareous_Algae
Encrusting_Algae
Seagrass
Silt_Covering_Coral
Cyanophycae
3.70
0.43
9.72
7.07
18.91
2.25
0.00
1.23
0.00
+ 3.49
+ 0.32
+ 3.45
+ 3.44
+ 5.97
+ 1.31
+ 0.00
+ 0.42
+ 0.00
1.76
1.69
9.67
2.79
10.83
13.01
0.00
0.37
0.37
NOTE:
Complexity and Topography are graded from 1 (least) to 5 (most)
All Substrate descriptions are average % occurrence
Std. Error
+ 0.53
+ 1.91
+ 0.21
+ 0.14
+ 1.78
+ 1.78
+ 7.46
+ 7.46
+ 7.64
+ 0.09
+ 0.00
+ 0.46
+ 1.18
+ 0.64
+ 1.09
+ 1.15
+ 6.01
+ 5.45
+ 0.14
+ 2.18
+ 0.82
+ 3.67
+ 0.96
+ 6.13
+ 0.59
+ 5.87
+ 1.76
+ 1.62
+ 3.28
+ 0.82
+ 4.16
+ 4.45
+ 0.00
+ 0.21
+ 0.25
48