Initial report on the quality of the vitogo river

1 Pages 1-10

▲back to top

1.1 Page 1

▲back to top
INSTITUTE OF NATURAL RESOURCES
THE UNIVERSITY OF THE SOUTH PACIFIC
TECHNICAL REPORT 86/4
INITIAL REPORT ON THE QUALITY OF THE VITOGO RIVER AND
ASSOCIATED ENVIRONMENT BEFORE THE CONSTRUCTION
OF AN INTEGRATED SAWMILL/CHIPMILL COMPLEX
AT DRASA, WESTERN VITI LEVU, FIJI
Philomena Gangaiya, J.E. Brodie, R.J. Morrison
(Originally prepared for the Third South Pacific Regional
Environment Programme Consultative Meeting of Research
and Training Institutions, Guam, June,1986)
May, 1986

1.2 Page 2

▲back to top
l
1 • Intr·o <).!::i.<;Jj_.QJJ..
Development activities in primary producing countries depend
largely on the exploitation of natural resources which tend
to be more vulnerable in tropical regions than elsewhere.
Every effort must be made to preserve the natural resources
for sustained development.
Excessive demands on limited
resources will result in significant deterioration of the
ecological systems upon which life depends. Indiccitions of
such misuse usually show up as soil erosion, lack of water
or its quality, deforestation, depletion of ecologically
important life forms and other adverse natural phenomena.
The implications of such effects on the quality of the
environment should cause even .more concern if the area to be
developed has been relatively free of environmental problems
as in the case of the Vitogo River and associated bay area
in Western Viti Levu, Fiji, where a sawmill/chipmill is to
be constructed to process the pine timber cultivated in the
adjacent forests.
The Vitogo river enters the sea near Lautoka, the second
largest city of Fiji. Until the last tlecade all industrial
development in this area has been confined to within a few
kilometres radius of the city. The area under study <which
falls outside the city boundaries) has not been influenced
by any major environmental changes arising from industrial
development. In the surrounding hills a major pine forest
plantation has been developed over the last 25 years. While
some pine harvesting has occurred, little wood treatment has
taken place; the effects of harvesting on the environment
have therefore been considered to be minimal. However, the
construction of the sawmill/chipmill may significantly
affect water quality in the Vitogo river and associated
coastal areas. The effects of the mill on the quality of
the environment can be evaluated in future only on the basis
of comparison with the present state cf the environment.

1.3 Page 3

▲back to top
2
Qovi ousl Y, ti·n· 5- necF2ss;:i. tc,1·be�; the compl E0ti on cif a l::lasel i r"H:0
study. The Institute of Natural
1-Jith financial
support from SPREP, was able to carry out the basel inf:1
study, the objectives of the study being:
to generate baseline data on the quality of the Vitogo
river estuary and adjacent coastal bay area.
to assess the potential impact of the wood chipmill on
the quality of the studied area and provide a proposal
for mitigation of effects.
This ,�epcir·t
of the findings of the baseline
study.
This i ntrcicluc:tci1···y secti c:>n is -foll m-.,ecl by c,I
descr·ipticm of thE? physi cc�l characteristics of the study
Secticin 3 records details cin 1 cic .;;d:. :i. on of samplin(J
sitc-,?s, sampl e�5 collected, regularity of sc,1mp 1 i ng and
analyses performed. Results and discussion of environmental
quality investigations follow.
Section 5 projects the
potential impact of the development on the environment and
possible mitigative measures. Some concluding remarks are
made in the last section.
2. Df.0.sc_,,.._iption o·f (-k'E.1 a
The geographical setting of the area under consideration
with 1'·E1spect to Lautoka city is shown in Figure 1. ThE?
location of the processing complex, about 14 km no,,·th-Eiast
of L,;1utok.,,1,
is also indicatr-,?d.
Some physical
characteristics of interest are outlined below:
The area is of variable terrain, from a coastal plain
to gently rolling hill country a few kilometres in the
interior to moderately steep dissected steepland along
the foothills of the Mt Evans Range. Elr�vation rangr?.,.,,
from 40 m (above sea level- asl) near
540 m asl in the vicinity of the Lololo forest lookout.

1.4 Page 4

▲back to top
''''
\\
\\
....
', ''
\\
\\
,.. I
I, __
' ,, . rf"
-\\,I
, -- ,
,- II '.. ,
\\\\
\\ \\'
\\ l.-')·
.... ,,
,,_J
�,,
\\
\\
\\,_
-\\�
.>..-
rel
-c:,
..
n,
>
.0 ,._
c,,
C
"'
.,,T.J
C.,_
U1
L.
·-..>O.J.
=C
Q
...C.l.
...uIl,l
..C...l
1LJ.J
:...<
I
!'
'\\
\\
,,
'\\
.
(
.... _,.,
.. ',
.
.
, .. _,___
_ ......r
.... ,I
I I' .. -,'-•)
{
\\
', I
,'I
\\,
I
.,
ew<rI::
I
<J:
\\
,,I,,
.
I
.,I
Q
:::J
1-
(!)
w
I
1-
1.J..
CJ
z(!J
H
fwe­n
_J
uo:::r:
H
I
0..
c:c
Cc'.
(!J
0w
f.!)
cw.c
:J
(!J
H
I.J..

1.5 Page 5

▲back to top
4
The elevation of the mill site is approximately 60 m
asl.
The site 1s on the norther n side of a gently
sloping ridge, falling towards the north - west, c:m tc>
the coas;tal pl a:i. n. Between 1 and 4 kilometres west of
the site is the coastal plain which extends to the
south west past Lautoka.
The geology of the Lautoka area is described in detail
by Bartholomew (1959). The rocks underlying the higher
elevation areas are mainly of volcanic origin, deriving
from basaltic and a ndesitic volcanic activity during
the Plio-Pleistocene period. The rocks include augite
- olivine basalt flows, tufts, volcanic brecias and
associated sediments.
Th~ sediments of the coastal
plain apparently comprise , about 10 metres of clayey
""-ll uvium.
'.:;:. ::::; r;o i 1.;;
The soils in this area form a complex of xisols,
Ultisols and Inceptisols with minor areas of Entisols,
Alfisols and Mollisals (Twyford and Wright, 1965;
Leslie et al., 1985).
U:-: _:i. S_C)_l ,f.5_
th se are typical
thr-1 hic;;ihly
weathered and highly degraded dry zone areas of Fiji.
There have been formed in materials that have been
intensively weathered chemically and frequently have
oxidic mineralogy. They generally have red colours,
dE1ep p1·-of i l c:?s ,1 high porosit.y, weak s tructures and are
E~r·osi on pr·o ne. Th ey tend to be moderately acidic (pH
5-6) and low in Ca, Mg, Kand P.
W\\tisols (us uall y oxic subgroup) : have better
structures than xisols with clay accumulation in

1.6 Page 6

▲back to top
5
subsoil
The mineralogy tends t6 be
kaolinitic and oxidic. They generally have red or red-
are moderately to strongly acidic (pH
4. ~:i-6) and are farmed from weathering products of
basalts and andesites.
In a few areas soils having
similar morphological features but having high base
status (Alfisols) have been identified.
In some highly degraded areas erosion has removed most
of the soil profile leaving a thin surface layer on top
of i~ s~tu weathered rock. These soils are frequently
strongly acidic (pH 4-5) and are classified as Entisols
c:ir Ince~pti~:,o.l~~-
There are limited areas .of shallow, dark, soils found
particularly on steeper slopes and formed from uplifted
sediments.
They are strongly structured due to the
presence of montmorillonites which stabilize soil
aggregates. These shallow dark soils (known locally as
Ni grescent~;;) have a high pH (pH 6-7.:::::,
relatively ri~h in phosphate, bases and organic matter.
These soils are classified as lnceptisols or Mallisols.
2. 4 Cl). mc:\\tf.'~.
The island of Viti Levu is divided climatically into
two zone~,,, the north-west (project area) region having
a marked dry se ason from May to November and the south-
east region having a humid climate with a more evenly
di tributed rainfall .
Surface wind direction and
speed in the region exhibit a marked diurnal variation
(Sharma, 1982). During the day westerly to north-
westerly wind flow (sea breeze) usually prevails while
south-westerlies usually predominate at night time.
South-easterlies tend to be augmented by a downhill
wind drift from the east, ie a night time land breeze.
The average annual temperature of the area under study

1.7 Page 7

▲back to top
6
is 26~c and the average annual rainfall is 2~500 mm at
Lololo which is the c l osest monitoring ~,tat:i.o n tn thE':
st ud y area [Fiji Meteorological Service
information supplied to Cawthron (1984)].
'.,?" '.5 1VE~_g0;:,t..2\\ti..Ci_rl_
Most of the s t eeper slDpes of the region are under pine
cultivation as shown
in Fiqure L
Th e pines were established on badly
d f:?CJ ,,- ac:Ir:~d
qrasslands.
Tal asiga vegeta ion
c::uni::; :i.st:i. nq o+
po,l_yf,;_tac:hyon)? l< c:lr·uk El fF.•1r·n (F:'tE)1r•:i...c:l,i . urn f:?_i::;c:ul_E)_f"ltum,), ()2,to
n f (::)I'" <D_:Lc.t·".i:\\_nc:ipt_<::!t'-.i_i,, l . :i...n,c;:i c,r- :L_!s_ ) a nd No k un o k o
(C,,,l.~,_U,<':'ll'".i.n_c\\_ r,)_q_L.t.:i...i::,f•,:•t..:i...+ol:i.J,,\\_) Cc.'\\r·, i::; t:i.11 be +ouncl ir·, palcE~!::;.
Remnants of indeginous hardwood forest occur with in the
pine plantations.
The n,,,1 t:i. ve
( M,i,S-3,C:,i::\\ nt,h,L.tf,,;_
+_l ,uri.ciu lu.~.;_) an c:1 t, h f::: (:) Ui::l Vi::\\ ( F'_s; :i. ,cl,iurn q Ui::lj c:'t V,::1_) a t"'(·?~ C Off1illCil")
in such a1·-0?,:1s. The +lat coastal area and the rolling
countryside have been utilized fo r intensive sugarcane
c:ul ti vc:,,t ion. The lower reaches uf the Vitog river and
the Vit go Bay have rich stands f mangroves.
Th€? major
the catchments of the study
area are the Vitogo and the lc-::ii di:\\filU n
these two rivers are marked in Fiqure 2.
Vitogo t'-ivrat'-
particular interest in th :i. '..:; ·:::, t.uc:ly
because w~ter requirements of the mill are to be met by
drawing water (position marked in Figure 2) at
of 0.015 m3 /sec from this source. Th e catchment area
of the VitogRiver extends well into t h e foothills of
Mt E:vanr~
The ma jor.
VilakolewasautokCreek, Savubasaga Creek and the
headwaters uf the river itself. The Te:i.damu River is
also of interest because it drains th e area around the
mill. These two rivers constitute a major proportion

1.8 Page 8

▲back to top
/
--✓
/
/
/
i
i
J
i
\\
' ' ....
"' \\
\\
I
J
/4
CATC.\\\\WE.NT" "(\\~EA .,/.,
✓-
_/
.,,. _,... --
/
I
I
I
I
I
I
I
I
I
I
\\
_\\
\\·
\\ ...-- X S1'TE Fol<?.
)..,. . \\ Ml\\.L
DF.~w-oi='F
\\
I
I
I
/
/
/
I.
\\
I
I
/
I
/
i
I
I
.. ....
l
I
\\
\\
',, \\
..... ..... ....
I
\\
--·, \\
,..... ...\\
mangroves
I
\\
_/
road
I
I
I
I
rivers anq creeks
"\\
\\
l
\\11T06C
l
\\
/
I
I
I
I
I
., / catchment boundary
/
/
for rivers
FIGURE 2 CATHMENT AREAS OF THE VITOGO & TEIDAMU RIVERS

1.9 Page 9

▲back to top
8
of the freshwater input into \\)i to(;JO Bay.
water inputs to Vitogo Bay are shown in Figure 3.
::!;. l•'IE:thc:icl__,,Ci+... .... I,nvE-)_<:;;_t,i,q .::d:.,:i...on,
A preliminary tour of the project area was made in July 1984
to determine accessibility to potential
availability of apQr priate sample types that would indicate
water quality and the precautionary measures that would need
to l::i(~: t.akr-:,:n f OI'" sample
lcication o+ Si:Hllp 1 :i. n q
preservation.
DE?tai ls on the
dates + sampling, types of
samples collected and the analyses performed are outlined in
·t·. .1·1 :.i. s:; ,,,E:c ·l:. 1. on.
:~;" 1
~::;i:',\\_rnp l.f.'::.......C.ol,1 _f:,i.c::t_:i.. cin.
Thfi.·: t ypE·: o+ '.,5,,\\mp l (•;,-') that is usuall y collected i 1'1
investigations into water quality is the actual water
:itsel+.
looking at water quality from
vi e1t1 of pollutiCJn onE? of ten
measure parameters that, in
ar-(? pt··r::.->·:,E::> nt. in
extremely low concentrations, such that detection 1s
impossible with the +acilities available.
The higher concentrations that CJccur in bioaccumulator
i;;;Eic:lirnc~nts with which the water in
in contc,\\ct cari hE) LlSf.c!c:I as a pr:,\\r·t.1 al
solution to this problem. Sediments and shellfish can
be ver y appropriate indicators of water quality because
pul 1 ut i ng
~,,uch as heavy metal s tend to
concentrate in s uch samples and are there+ re more
easily detectabl e. Bes ides, studies on heavy metals in
l.Eif::'f ul in themselves because they
indicate the quality of shellfish which are u sua lly
heavily harvested +or human consumption. ~,Ji th thes,if:'',
c:ons:i. d(::•r· a t :i. on!,', in m:i. r1cl :i. t ~•Ji:',1 s d ec i cl Eic:I
·s(~)di m(;,1nt 2:1 ncl shellfish samples would be collected from
various sit.es within the )'Study i'.11'"<':'!i:':\\ CF:i.gu1···0.~ 4) +01···
quality, heavy metal and coliform status

1.10 Page 10

▲back to top
9
s
)
FIGURE 3 FRESHWATER INPUTS INTO VITOGO BAY

2 Pages 11-20

▲back to top

2.1 Page 11

▲back to top
10
· \\JITOCtO
e:. t\\'(
XC,nth1.1cbbn
. ~,s\\e.
R ~ ah.-r df'ow- o fo1f\\-r
\\
(!)'\\
FI GUF~E 4 LOCATION OF SAMPLING SITES

2.2 Page 12

▲back to top
11
detet-mi nation. The most common species of
s:; h e:-il 1 f i ~; h f cJunc:I
fo o d source for the loc a l villagers. Water- was sampled
at five
sites (mar-ked
1 to
c.-
~
1. n
Figur-e 4) along the
V:i. toga t-i V<;? t··
1984 to .July 1985 fm-
quality deter-mination. During the same:!
p er-i od se dim e nt ~ amples from Site 5 (the mouth of the,,)
Vitogo r-iver-) 2md sediment and shellfish samples fr-om
Site 6 wer-e collected. Fr-om September- 1985 to Janu ar- y
1986 sample co llection at sites 4 and 5 was stopped.
Water- sa mple s we re collected for- heavy metal analyses
only, +rom Sit.es 1 to 3 along the Vitogci r-ive r and
Sites 7 and 8 along the Teidamu river. Sedi.mE)nt~, and
shellfish were collected.from Sites 6 and 9 (along the
mrn..tth of the Teidamu River).
A summary of this
information is giveA in Tabl e 1.
Th f:?. samp l_<:Js co ll ectf:?.d
br·ought back
I ,. ,s-, t i tute of i'-J atu t··a l Resources Analytical
Labor ato ry where all c::1nal ysr?s
Analytical procedures are outlined.
to thE!
out.
C:_onclu,c:,t,iy it y \\.'Jc':\\ s rn E! as u r e d On a conductivit y meter
standardiz e d against a standard salt solution.
pH_ wa s me:~asured w:i. th a glass electrode stan-
dardi.zed ag ainst buffers of pH 4, 7 and 9.
~:3_,::d.i _ni.t y was measured ur;;ing a salinity mr.~tE?r
standardi zed against a s alinity standard.
a nephelorneter against
suspended silica standar-ds and is expressed as
nephelometr-ic tur-bidity units (NTU).
A.lJ::.a.l..i. ni. t y ~'-Jc:1s measun:,1d by t.itxating an aliquot CJ-f
thf,~ samp l !c?. with stand,:wd HCl to the phenolph-
th a lein en d point for carbonate a lkalinity a nd the

2.3 Page 13

▲back to top
12
TABLE 1 : SUMMARY OF INFORMATION ON SAMPLING AND ANALYSIS
Dates of
Sample types
Collection
~:, i: 1.mpJ. :i...n.9 .. . ..............cu1. 1. c=:i.c::.t.c-::i.cl................._. ··············-·····!:3 :i...t.c;!.s.......................................
Analysis performed
,Jul y ) .9.El4..
,("~"'1E?p
l\\lo v
.Ji::\\r\\
Mi,H-
May
19f34
1 ci'BLJ.
:l 98~:.i
1985
19!:35
.Jul 1985
i;Jatet-
!:ii tE1 S 1 to 5
General Water ·quality -
conductivity, pH, turbi-
dity, salinity, alka-
1 :i. nit y, Ca, Mg , Ni::,, f<,
Fe, Mn 7 Cl, SiD2, 804,
N03 7 NH3 1 TN, TP 1 P04 .
Faecal and total
col :i. f m-mi,;
bediment
l~lh rr:, 1 J f :i 11:,h ...
\\3i t.es '.:.'i g~ 6
Heavy m0?tal s; ·(As 7 C:d ,,
Cr 1 C:u 1 Fe 7 Hg 1 Mn 1 Pb 7
f.:,c::~ 1 Zn).
Heavy met als (above)
i,,\\n d col i. -f- or··mic,
,C.:,' ep 1985
l}J ii:\\ t E:
!3:l tc,E.• l ,, :;:: 1
::r. , 7 ,:3.nd 8
Heavy mE:::tal -,.,
.J c:\\rl :I.r-186
!3hc:::,:t l ·f i i,; h·...
Hec:\\VY mE·:.•tc":\\l s
l···leavy m01t i,d. s
Co l :l fcir-mE;
* Shellfish samples could not be a nalysed for organochlorines
as previously anticipated because the laborator y could not be
suitably equipped in ti.me for s uch an analysis.

2.4 Page 14

▲back to top
13
mixed bromocresol green methyl red end point for
bicarbonate alkalinity <APHA-AWWA-WPCF, 1981) .
C:,E:1.l . c.i.u.m. !1•....•.•....•.m.c:1.CJ.rl.E-).£5.i_.um..!1..............s;.ci.d .i...u .m.....__....a .n c:1 ..... pot c:\\.S s .i urn WE-~r· e
suitable dilution by ·f 1 ame atomic
absorption spectroscopy (FAAS ) .
Ch.l. or)..d.e was
a chloride ion
se lective electrode.
~~ lphat~ was me as ur ed u s ing a turbidim etr ic barium
sulphate mE?thod.
E>). l . i .c.ic1. (di sso l VE2 d) was measu r e d by a colorimetric
procedure by formation of the reduced beta s ilico-
molybdate complex.
D:i..r::>.~:;Cl l __v.e::) c:1_......ir·.n.n . . . . . .. c:l.n .d .......m.an .Q.::\\.n .E).~;~.e WE' 1r• (? mec:\\ ~; ur f:? d c':l ft f::• t-·
filtration of a sample which had been acidified
immediately upon coll~ctio.
The filtration,
through a 0.47 m membrane? was completed under
vacu um and iron and mangane s e determined by FAAS
on the filtrate.
Tot a.J..............iI.o.n... cH·i c:I .......m.21n.g .an er:oE) wer e determined on
another aliquot of the acidified sample.
concentrated perchloric acid was a dded to 100 cm :;:!:
o f the sample and the mi:•: tu,~e heated and
evapor·ated unti 1 fumes of perc hloric acid were
€·? Vt:>1 VE~d.
ThE? d :i q<;?.st was diluted to 100 cm 3 and
iron and manganese determined by FAAS.
Tot c~1 ~,:: ;i <:·!.1..d.ah 1 Nitrogen was mea s ured by Kjeldahl
digestion using sulphuric acid, potassium s ulphat e
and a selenium catalyst followed by steam
distillation of the ammonia and determination by
thE) i ndophE~nol blue colorime tri c method (see
a mmoni a method following).
Tc:>.t .c\\1.............Pho~:;p hor·_1.t.1=~.
nlf:::•a ~;; ur. ecl b y thE~ ortho--
phosphate rnf2thod (see 1 c:1te1·-·) af t1=-~r- d i gest ion of
th e water sample with perchloric acid to fumes.
Ammonia was meas ured using the indophenol blu e
colorimetric method <APHA-AWW A-WPC F, 1981).

2.5 Page 15

▲back to top
14
··:r '') r-:i
•-· II ..:.. ,,;_
Ni~rat? was measured by the cadmium reduction
c:olumn pr·oc ed L.u~ E:' and s ub <::,£?q urant C CJ l OJ~ i ffiE:!t.Jr• i C
mc-::iasur·emEint usi nr;J sulphanilamide and 1-naphthy-
lethylenediamine dihydrochloride to produce a red
- azo compound (APHA-AWWA-WPCF, 1981).
followed a standard
molybdenum blue/ascorbic acid method <APHA-AWWA-
WPCf'.·, 19U l l •
H_E!c:I_VY.......rni-::d: ;::1_1y;
heavy metal analysis
WE?r·e ac: id if i e:~d upon sampling to a pH of less than
2 with nitric: acid.
The mercury sample was
preser. ved with addition of potassium
dic::hrDmate. Cadmium, chromium, coppe1~, l t'?ad and
zinc were measured by co~plexing the metals with
ammonium p yr Cl l id i 11 E?
di th i ocar·bamate U-'iF'DCl ,
E'Y:•: t.1~ acting thl-:? comp le:-: ed form into an organic:
solvent <MIBK) and determined using FAAS.
and ~~e l eni um were determined by the hydride
technique and mercury by the cold
vapDur
usinq
El mc-::>r
Mercury/Hydride System ( MH~;--10 l linked to an
atomic absorpti on spectrophotometer.
the membrane filtration method (APHA-AWWA-WPCF,
l 981 l •
(.)n.a.l y ~~i. ~5.......c:>.+........~.:;_cc!d.i ..m_F.2 n.t .s.
Sediment samples were air dried and aggregates
broken down to <2 mm in diameter. Fm- tot,,d heavy
a 0. ~_:; g sample was digested
completely with a mixture of perc hloric/hydro-
fluoric:/hydrochloric acids and made up to volume
with deionised water. Fo1,. Wf.:>ak
h(:.!a vy met.al s? a 0.5 g sample was left to stand
CJVet'-night with ;::1 '.;;;'.5 '1/. sol ut :i. on of c,lc:Eitic c:1c:id,

2.6 Page 16

▲back to top
15
c:emtr· :if uged
the s upernatant used for deter -
mination. Heavy metal s such as cadmium, chromium,
copper, i ror·1, m,"mgE,u··ie~,;e , l f.:!ad and zinc: wer·e
mE-ias ur··r-2 d u s-; i. ng flame and graphite furnace atomic
abs:;01,.·pti on spectroscopy.
Arsenic, selenium and
mercury were determined as for water samp 1 es ( s-,ee
abov0:•) .
f'.\\n.a_]. _y!::;_i ..f:'i......c:;+__._ _sh,E:d. l_+_ i ..s:;.h
The flesh from approximately twenty shellfish from
each site was homogenised to give a composite
s;amp 1 l"'?. A subsample was digested with nitric acid
and heavy metals in the digest determined by the
techniques described above. Coliform counts in
the sample were det~~mined by the multiple tube
technique.
Moisture content cif the sample was
measured by determining moisture lost on drying a
subsample at 105°C to a constant weight.
4. F~E!.~~.ul.t .s;.....J,1 nd .......Di_s:;_c,us:;f;_j...o,n
4. 1 p E' nr.~ r.. .::1J........l-'J .::d:.E) r.. C! u ;:d i t y_
The results of the analyses carried out on the samples
from the Vitogo river far indication of
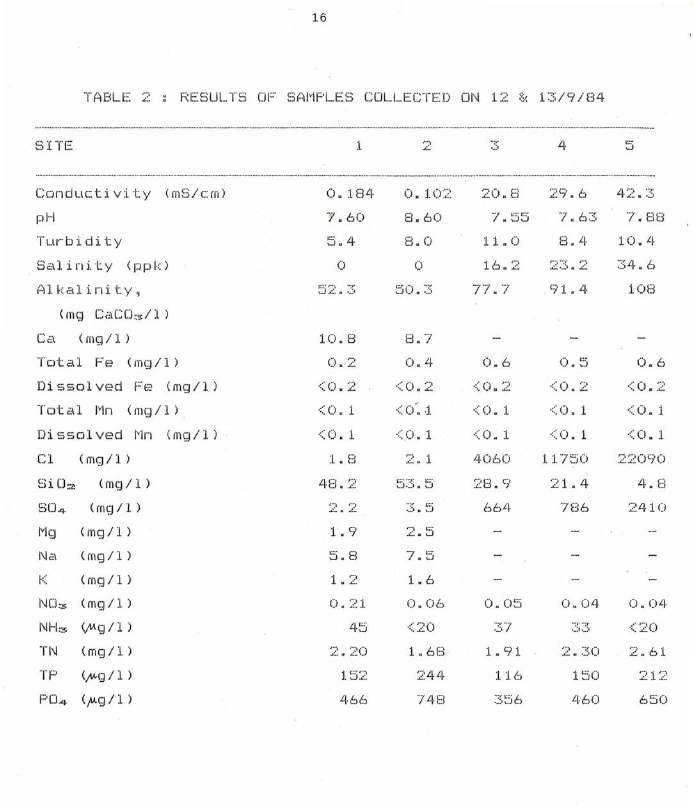
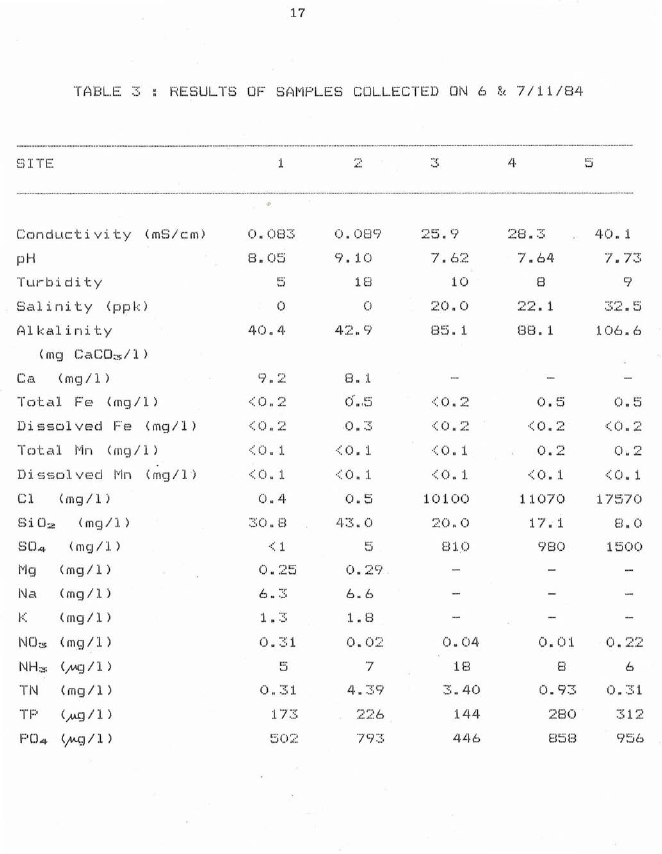
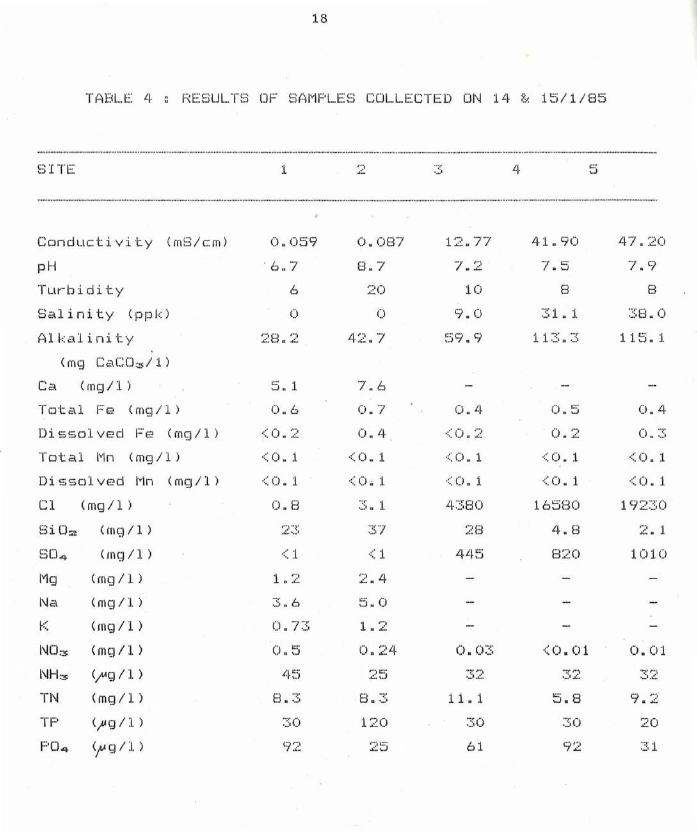
general water quality are given in Tables 2 to 7. Some
characteristics of the river drawn from visual
observations made during sampling trips, interpretation
of data assembled over the duration of the project and
from discussions with other interested parties (e.g.
hydrologists) are outlined below~
4. L l
Vi tnqo ....f(_i.,v.0:, Fl ow
The Hydrology Section of the Ministry of Works has
carr· i ed out occasional discharge measurements
since 1969, and more regularly since August 1977.
Fortunately 1 the flow measurements have been taken
at a site which coincides with one of the water

2.7 Page 17

▲back to top
16
TABLE 2: RESULTS OF SA MPLES COLLECTED ON 12 & 13/9/84
_ _ - _,,.............._..........................................................................,
..........................................................................· - - - - - - · · ·..•···.................................................................................... ............................
SITE
:I.
,. ...
... ::.
4
5
Conductivity (mS/cm)
pH
Tw-·bidity
Sc.d i rd t y (pp k )
{ U k a l i n i t y .1
( rnq C,,:1CU:::r. / l l
C.:::1 (mg/1)
Tcltc,l F"e (mg/1)
Dissolved Fe (mg/1)
Total Mn ( Ill(~ /1) .
D:i s:; sol ved i'"lr1 (mg/1)
Cl ( mg /1)
Si Cl:.? <mq/1)
su ✓••• ( mg /1)
Mg (mg/ l )
l\\la ( mg /1 )
K
<mg /1)
l\\l (J ~!, (mg/1)
NH:;'!: (,M g /1)
TN (mg/1)
TP (;"'g / l)
PD4 (,Mg/ 1 )
o. 184
7.60
5.4
0
O.l02
8.60
8.0
0
50. :::::
20.8
7.55
11 .0
16.2
77.7
29.6
7.63
8.4
23.2
9 1.4
7.88
10.4
34.6
108
10.8
<0. 1
<O. 1
1. f.3
1.9
5.8
1.2
0. :;:: 1
l5'.?
B. 7
0.4
<.O. 1
2. l
2.5
7.5
1.6
O.Of.:i
<20
1. 6f:3
'.:::'.41.1,
71.1-H
0.6
<O. 1
<O. l
4060
'.::i:8. 'l
664
0. !':5
<0.2
<0. 1
<0. 1
:t 17 :.:'iO
21. 4
786
0.6
<O. l
<0. l
2'.:~090
4.H
2410
0. 0'.5
1. 91
116
0.04
1'.'.".iO
460
0.04
<2(>
2.6:l
650

2.8 Page 18

▲back to top
17
TABL...E ::~; RESULTS OF SAMPLES COLLECTED ON 6 & 7/11/84
_ _ _ _ _ _ ....-..,_,......,-,..................................................... .................-,....................-.................................................................................................................,..
................................................................................. ..
f3ITE
1
4
5
• • - - -- - - - - - - - -- - - - - -•-••-"' "''M•••••• . •. •-••• .,.. .,,,,,,,, ,.,.,,,..,,.,.,,,,.,.,,,,.,,,,, ,,, .............. , . .............................. ,m...,.......•••••••••....•••••• ..• ............• ••••..
Conductivity (mS/cm)
pH
Tur·· bidi.ty
S21linity (ppk)
(Hkc.,lin:i.ty
( mg Cc:1C~/ l )
C,:il (mg/1)
Tot.-,:\\l F·e (mg/1)
Dissolved Fe (mg/1)
Totc,11 i'in (m<;:J/1)
Di. s,sol ved Mn ( mg /1)
Cl (mg/1)
Bi D:.e (m<J/1)
80.q. (mg/ 1 )
jvjg (mg/1)
Na (mg/1)
~:: (mg/1)
I\\ID:.'f, <rng /1 )
NH::$ (;W] / l )
TN ( mg /1 )
TP (p.g/1)
F'Cl.q. <;v,-r;i I 1 )
o. os::~;
8.05
,c_:.:,·
0
40.4
9.
,.,
..::.
<O .. 2
<C) :~
<O. :I.
<0. :L
0.4
::::o. 0
<1
1. :::;
(). :~;1
5
1T:::
9. lO
1B
()
42.9
8. :l
c:f. ,'.5
<O. l
<0. 1
:=j () A
4::::. 0
c::·
,•.J
(l. :~:9
6.6
1.8
0.02
7
4. :::8
7. 6 '.?
10
'.:::'O. 0
8~5. 1
<C>" 2
<O. 1
<0. l
101.00
:::o.o
o. 04
Hl
:~; . 40
144
446
7.64
8
22. 1
ElB. 1
40. 1
7. TS
9
:1. 06.6
0.5
<<) . L'.
(). 2
<(l. 1
11070
17. 1
980
0. ~5
<(). ~~
o. 2
<o. 1
17'.570
El. 0
:l500
o. O:L
8
o. 9-;·,-;·
280
851::l
o. .r.·:~:..,..:.:..,.
6
o. :::; 1
:-2:: 1 ::~
956

2.9 Page 19

▲back to top
18
TABL..E: Lj. RESULTS OF SAMPLES COLLECTED ON 14 & 15/1/85
E3ITE~
_ __ ......................................................................................................
1
::~:
- - _ _ _ _ __ - - -............................................................
.............................
Conductivity (mS/cm)
pH
TLwbidity
Sc.-\\linity (ppk)
iC)lkalinity
<mg Ci::,CD::.,d 1 )
Ca ( mg /1)
Total 1::·f.'= (mg/1)
Dissolved Fe <mg/1)
Total !•in ( m~J /1)
Di sscll ved Mn ( mg/1)
Cl (mg/1)
Gi Cl:.\\: (!lH;:J/1)
SCl 4
<m~J/1)
Mg
(mg/1)
Na
( mg /1 )
~,...
( mg /1 )
ND~.:s: <m~~ / l )
M+.!S
TN
TP
<,.,,.,.<;) / 1 )
(mg/ 1)
<,,.ug /1 )
P04 <t<;J/1)
0.059
· 6 .. 7
6
0
'.?8. '..'2
0.087
8.7
2<)
0
5 .. 1
0.6
<0 . 2
<0. 1
<0. 1
0. B
<1
:~~;. 6
0. 7:~::
~5 () 11
8. :~:
::o
7.6
0.7
(l Lj. .
<0. 1
<0 • 1
:::::7
<1
2.4
~:i. 0
1 . ~r..,
.8 ··-::··
1'.?0
1'.2 .. Tl
10
9.0
0.4
< <). 2
<O. 1
<O. l
4:::::ao
445
11. 1
61
41.90
7.5
8
:~: 1 :L
1 u:. :;
47.20
7.9
8
:::::a. o
11~.:i.l
0.5
c). 2
<o. 1
<O. 1
165BO
4. E~
0.4
0. ::::
<O . :l
<(i. 1
~-:~. 1
1010
<O. 01
5.8
:30
0.01
20

2.10 Page 20

▲back to top
19
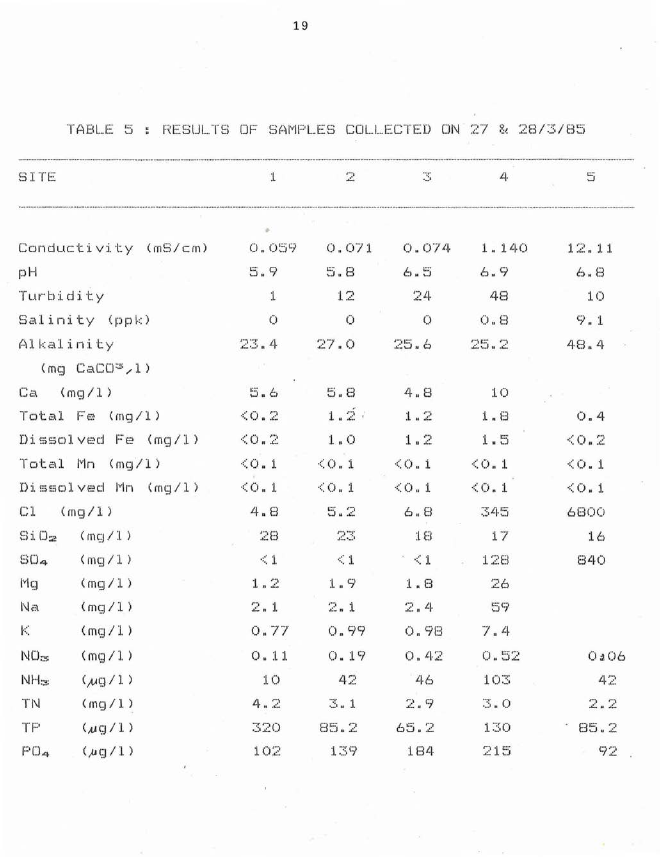
TABLE 5: RESULTS OF SAMPLES COLLECTED ON 27 & 28/3/85
- - - - ..........................-,..,.........................................................................................
- - - - - - ....................................
S IT[
:L
2
4
___.............................................................................- - - - · ·······"···....······.............................................................................................................................................. ..................................................,.........
Conductivity (mS/cm)
pH
Tur· bi di t y
Sal i.11i ty (ppk)
?-)1 kal i ni ty
(mg CaCU ::!!',,, 1)
Ci::\\ Cmc;J / l )
Tc>tc:\\l i::· r,,i (mg/1)
Dissolved Fe (mg /1)
Tot,::d Mn (m<J/1)
Di s sc>l ved Mn (mg/ 1 )
Cl (rng/1)
E:> i Cl:;;,) ( mr,:J / 1 )
bU4
( IIHJ / 1 )
Mq
<m<J/1)
Ni,:\\
( mg /1 )
.··.
(mq/1)
NCb: <m~~ I 1 )
NH::-.: <µt;;J I l )
TN
( m~J / l )
TF"
(,t1 (] /1 )
i::•04
<,ut]/1)
0. O~i9
5.9
l
0
0.071
'.'::i. 8
0
27.0
o. 07 1.1.
6.5
'.24
0
25.6
1. 140
6.9
48
o. 8
. . ,,-::,.t,:.:)I.':':).
5.6
<()II:~
( () n 2
< O. :L
<0. 1
4.H
2El
<1
1. 2
0.77
(). :I. :I.
:1.0
1 O'.~:~
5.8
1.0
<O. l
<O. :L
< :I.
1.9
0.99
0. 19
42
~s . 1
85. :;~
4.8
:L.2
1
"'
,. ,
..::.
<0. i
<O . :L
6 .. B
:LU
<1
1.8
'..?. 4
o. 9{3
0.42
:L (31.j.
:LO
:L. f3
<O .. :L
<0. 1
17
12U
26
7.4
10:::
1::: 0
2 :L ~3
1 ::~:. 1 :I.
6. B
10
9. 1
48 .. 4
0.4
<(>. ~-~
<0. :L
<0. :I.
6800
16
8Ll()
0.106
42
f35.2
92

3 Pages 21-30

▲back to top

3.1 Page 21

▲back to top
20
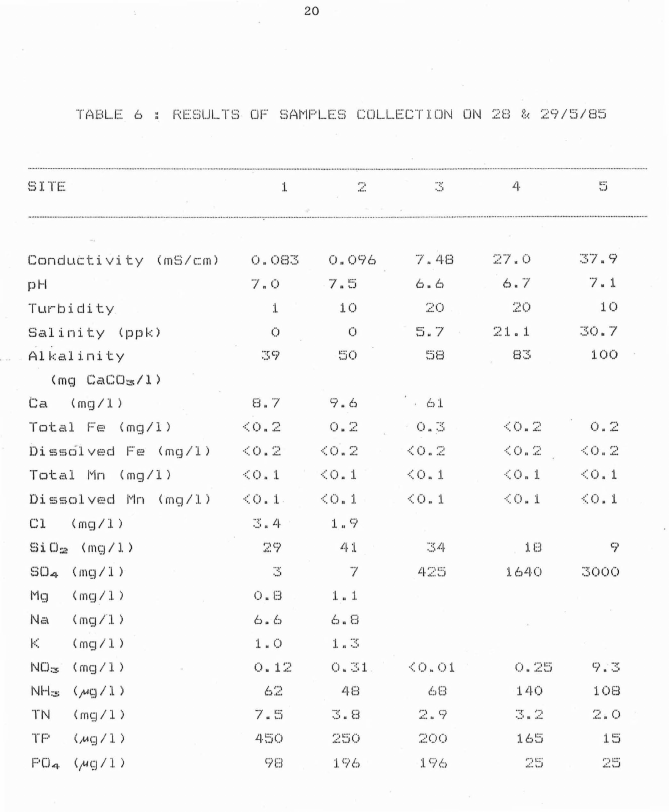
T('IBL..E 6 RESULTS OF SAMPLE S CO L..LECTION ON 28 & 29/5/85
SITE
1
4
Conclu t t i v ity (mS /c m)
pH
Tur-bicl:Lty
Sal i r1i ty (ppk)
Alkalinity
<mg CaCO::!~/ l)
Ca (mg/1)
Total i:=·e (nHJ/1)
Disscilve d Fe (mg/1)
Total Mn ( mg /1)
Disso l ved Mn (mg / 1)
Cl
Gi Cl:;;,i <mu/ l >
f30.,.. ( m~:J/ 1 )
M(J ( m<J / l )
Na <mg / 1)
~:"'•
(mg/ l )
l\\lO,$ (mg /1)
I\\IH ,.-.; (,M<;;J /1 )
TN ( mq / l )
TF' (,M<;J /1 )
F'Ci4 <1-4u I l )
o. 01:n
7.0
7.5
:l
10
0
0
50
f.•• '/
< <)A :~
<O . :l
<o. :l
9.6
0.2
<(i " :2
<O. :L
<O. :I.
1..9
0. B
6.6
1. 0
0. 1 2
7
:I.. :I.
6.n
:1..::~;
0. :~; 1
450
9U
7. /~.f:1
6.6
20
5.7
~.:i f.3
61
0. ~::;
<O .. 1.
<0. l
<0. 0 1
6H
27.0
6.7
20
::P.9
'/. 1
10
::'.;o. 7
1.00
<() •:;~
<O . l
<0. 1
() . ~2
<O . :;2
<0. 1
<O. 1
:1.U
:l.6Ll,O
C1'>
::~; ooo
0.2!'.:'i
140
165
10B
:~. ()
15

3.2 Page 22

▲back to top
21
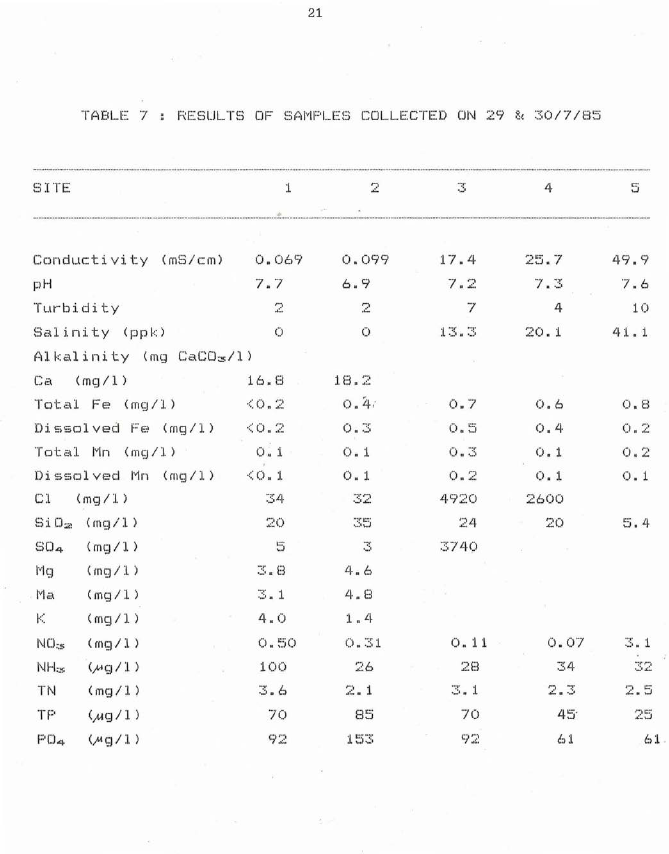
T(...'\\81..• 1:: 7 RESULTS OF SAMPLES COLLECTED ON 29 & 30/7/85
_ _ _ __ .......................................................................................................................................................................................... ..................................................
f3I TE
1
2
4
___ ......................................................................................................................
.....................................................................................................................................................................................................................
Conductivity (mS/cm) 0.069
pH
7.7
TLir-bi di ty
Sc\\li.nity (ppk)
(l
Alkalinity (mg CaC03/l)
Ca (mg/1)
Total Fe <mg /1)
16. El
<O. :~~
Dissolved Fe (mg/1)
<()A :;;~
Totc:\\l Mn (mg/1)
Dissolved Mn (mg/ l )
Cl ( mg /1 )
0. :l
<0. 1
:::A
E.1 i D:.:, (mg/1)
SC)4 (fill]/]. )
lvl<;;J
(mg/1)
;:::;_1:3
Mii,\\
( mg /1 )
::::; • 1
·.·.
( mg /1)
4.0
NCh ( m<;J / 1 )
NH,$ (pg/ 1 )
0. :.':iO
100
TN <mg /l )
:~;. 6
TP (;«g/1)
70
F'C)4 (,M ~:) / l )
0.099
6.9
2
0
113. 2
0 .1+ .-
0. :~;
0. 1
0. 1
::::~~;
....,' ':.!'
4 .6
'-1· .. 8
1.L~
0. :::!; 1
2. 1
85
:Ll.:i::::
17. ,~.
7. .,.·.~::.
7
1 ~:;. :~:;
25. 7
·-· 7. ":i·
4
:2(>. 1
49. 9
'I. 6
10
. 41 1
0.7
~=j () Cl
()" 2
4920
T/'-H;>
0.6
0.4
0. 1
0. 1
2600
20
0.8
() n :~
(> .. 2
0. 1
5.4
0. 11
2El
0.0'/
70
61
61

3.3 Page 23

▲back to top
22
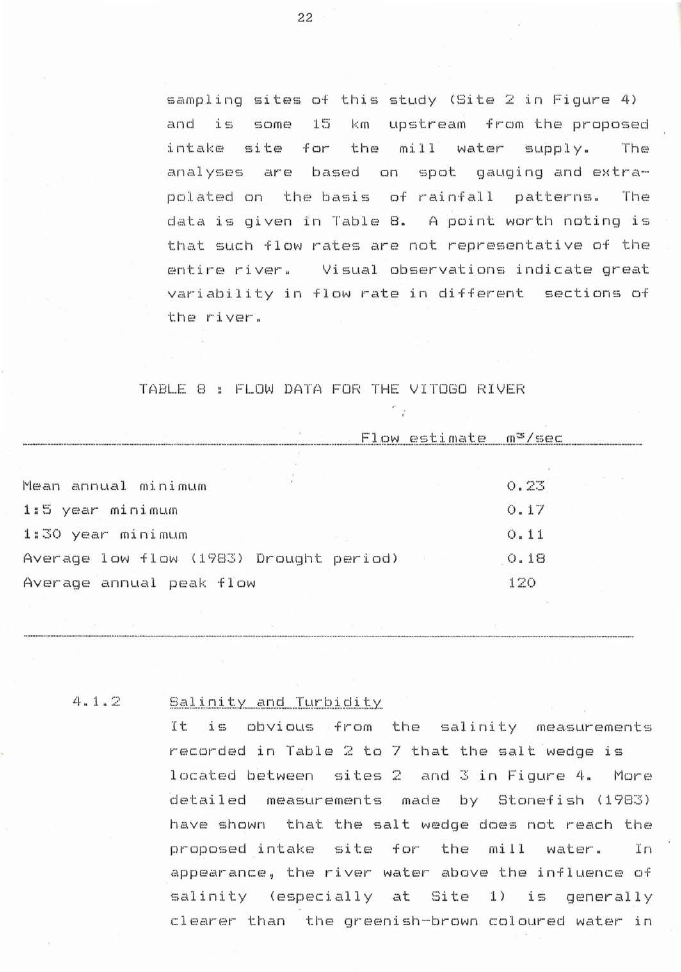
sampling sites of this study (Site 2 in Figure 4)
and is some 15 km upstream from the proposed
intake site for the mill water supply. The
analyses are based on s pot gauging and extra-
pol ated on th e basis of rainfall patterns. The
data is given in Table 8. A point worth noting is
that s uch flow rates are not represe ntative of the
Visual observations indicate great
variability in flow rate in different sections of
tl··1E! I'.. i Vl':!r...
Tf)Bl.E El FLOW DATA FOR THE VITOGD RIVER
._..._.............-..............................................................................................................................._.......-..-. -............-..........-........ F·.1.0.w........::1.~;.t .:i. _n1.c,1.t E! ............m.::$ / .s.E!.c: ·-· -- -
Mean annual minimum
1 : ~.':i ye:!.::1r mi n i mum
1:30 year minimum
Average low flow (1983) Drought period)
Average annual peak flow
o. 17
0. 11
. 0. 18
1 '..?0
4 . 1 .. '.2
E>.,:,1.l. i.ri.:i..,t:. Y.....J,1.n.d.......T.t..n..·b.i.cl.iJ:.y
It is obvious from the salinity measurements
recorded in Table 2 to 7 that the salt wedge is
located between sites 2 and 3 in Figure 4. More
detailed measurements made by Stonefish (1983)
have shown that the salt wedge does not reach the
proposed intake site for the mill water. In
appearance, the river water above the influence f
salinity (especially at Site 1)
clearer than the greenish-brown coloured water in

3.4 Page 24

▲back to top
23
4. 1. ~.:.
the lower reaches of the river - stirred up by
tidal movement and wind. It would appear from the
data obtained that prior to March 1985 there was a
build up of turbidity at Site 2. This was due tr_1
sey ere infestation of the site with water weeds
which restricted river flow and clearing of
t u 1"· b i d i t y .
The two cyclones in March 1985,
accompanied by torrential amounts of rainfall,
dislodged th it:,; accumulation from Site
and
carried it further downstream. The effect of this
and increased silt load condition due to high
1 f:2Ve l ~-, of rainfall can be seen in subsequent
turbidity measurements. The river in appearance
has virtually no silt load during the predomi-
nantly dry conditions. that prevail through most of
thEi year.
C_h_E~_m_i_c _al Crn'npci s i t:i. on
The water carried in rivers consists of contri-
butions from several sources. One of these is the
s ubsurface water and groundwater which re-enters
thEi surface (river) water and the other is the
direct surface runoff fraction which enters the
drainage system during and soon after precipi-
tation periods. In the case of the Vitogo river
the contribution from sea water up to a certain
point needs also to b~ considered. The rel i::1t i ve
inputs from each of these sources and the concen-
tration of dissolved species in each determine the
chemical composition of the water at the different
sites along the Vltogo river. The water of Site 1
1'-lh i ch is totally removed from any possible salt
influence,
havi. n<;;i its composition
affected by surface and subsurface contributions
only is taken for discussion. The compostion of
each of these waters is looked at before their

3.5 Page 25

▲back to top
24
effect on the river
is c::cmsi dered . The
sur· f ,:\\c: e. r-un off woulcl normally have only a s hort
contact with soil ,::-md vegetation <=lfid h~?mce thf=!
cc:impo~;;i.tio n of species disso:t·ved in it v-muld not
change dramatically from that in rainwater. TherE.~
i s a lack of data on rainfall composition for the
area under s tudy. Subsurface waters on the other
hand tend to cont,;1i n
mater-·ial
bec a u se o f their more intimate and 1 on~~et·· contact
with orq,;;1nic: m,;.~ter i al , soil and rock particles.
Often there is a direct relation-ship
compci~;:,i ti on of a subs urface water and its host
roe:: k. For the Vitogo area which has a substrat um
o ·f volcanic orig i 11 (see Section 2.2 ) s ub surface
water characteristic:: of bas,altic/ andesitic host
r·oc k i;;; wou 1 d bf.~ E~:-: p e:-1 c: t ed. Once again there is a
sho1~tc·,1ge ci ·f c:h<::-1rni c:c,11 c:ornposition data 01")
subsurface water~ in the area und er study. Data
reported by Garrels and MacKenzie (1968) -for thE·?
spring waters of Sierra Nevada an d considered as
being c::har~c:teristic of igenous rock areas is used
in th :i. !:i ~:; tudy for discussion purposes.
The
similarity in the Garrels and MacKenzie data and
the data from the Vitogo river (T ab l e 9) s hould be
ncJt(;,1 d .
poi ntE~c:I out the compo s ition of the
water in rivers is dependent upon relative contri-
buti ns from surface and s ub s urface sources.
During periods of low rainfall, the direct runoff
is smal l and the river water is predominantly of
subsurface origin which has reached solid-solution
equilibrium.
In this i r1stanc:e thf: sol utE.~
cc:inc:f:C1 nt1,·at ion in thE! i Y EW" is relatively
i nc:lep(~nd e nt of t- i VE!I~ flow. On the othE1r hand, if
di 1,--f2c: t 1-- un of ·f is larger than the flow that ha s

3.6 Page 26

▲back to top
25
penetrated into the subsurface? th e n the solute
concentrations in the subsurf a ce wa ter are diluted
by tht:i c:lir-E'Ct r-uno-f ·f.
Thui:;; the sol utEi
concentrations in
~•J,::\\t<•?r woul c:I bE'
in v ersely related to flow. Superimposed are the
influences of pollution and waste disposal which
i 1., the ca~5f=1 n+ Vi toqo a1rf? con 1::; i c:lr.,11-·cid to bE' not
v e1r y
significant.
f?~ I". t. :i. 1 i Z (·? I'..
r·unof-f
agricultural land may a ffect composition of river
water lower downstream. Table 9 which gives the
T(iBI....F~ 9
CHEMICAL COMPOSITION DATA FOR SITE 1
ON THE VITOGO RIVER
...........·- ····. ········ · - --
Sept 84 Nov 84 Jan 85 Mar 85 May 8 5 July 85 Mackenzie
.................................... .................................................... .......................................·-········-······-· ··-······················-······-····· ..···. -·--·····-. ... _......_._......__.....-...._..... ( 1 9.6 8 )
pH
..-;- (
I »U
t3. l
6. 7
5.9
7.0
7.7
6.8
Ca mg/1. :1.0. H
::i. :I.
~."i. 6
El. 7
16. El
10.4
Cl mg/1
LEl
Si •:;,: m<;;J/1 4U .. 2
0 • .I'.~
4.8
::::; • 4
::::;. 'l
l. 06
'.?LJ.• 6
BD 4 m<;;J/1
1v1g mg/1
2 .. 2
:L .. 9
<1
<:I.
0.25 :1.. 2
<l
1.2
0.8
c::·
, •.J
:~::. B
2. :59
1.70
1\\1,,\\ m~J / l
'.:'i. FJ
6.3
3.6
2.l
6.6
:~:;. l
5. 9~:i
K mg/ 1
:I. .'.?
1.3
0.73 0.77 LO
4.0
1. ;:'i7
NO~$ m<;;J / 1 0. ~2 l
0.31 0.50 0.11 0. :1.;::
0.50
0. '.~!f3
r,. d.
40.4
28.2 23.4 :~:9. 0
n. d.
~.'i4. 6
___ ························- - -···-· ······-······..···············..............................._..........
......................................................,
not dete1·-mi nr~c:I
concentration of certain di s sol v ed species at Site
1 at different times of the year
effect discussed quite clearly. A dilution and
hence a decrease in the concentration of most
parameters under consideration is noted during the

3.7 Page 27

▲back to top
26
rainy months (November to i"le:\\Y)
In the l.ci~..,er·
the c;:dft~ic:.t
thE! compos.;ition
the
watc-ir
increasingly obvious
evi dr-:,nced
in conductivity, s,alinity and ionic
c:Drnpo~;;i ti on.
Althouqh a t suitable concentrations some heavy metals
are essential for enzymic activity, they also for~ ~n
of enzyme inhibitors when natur 2d
concentrations are exceeded.
as (~g, Hg,
Ccl, Cu c,1nd Pb are particularly tCJxic and usually
inhibit enzymes by forming mercaptides with sulphydril
groups; v-Jh:i.ch are responsibl~ for catalytic activity.
Consequentl y, most heavy metals whether essential m-
not are potentially toxic to living organisms ~nd their
:i.n the environment llf?E:- ds to be ca1--ef ul l y
mon i tor·f.-?d.
4. 2. 1
!:Je,;JY..Y...t:1 E! t c:\\ l s i n ~J..{}tI~.C
The concentration of heavy metals (As, _Cd, Cr, Cu,
H<;J, 1:::•b, Sf,~, Zn) in the Vi toc;:JD river and thE!
adjacent Teidamu river were found to be less than
their respective detection limits for the period
Cl-f th :i. ~. ~:,tudy.
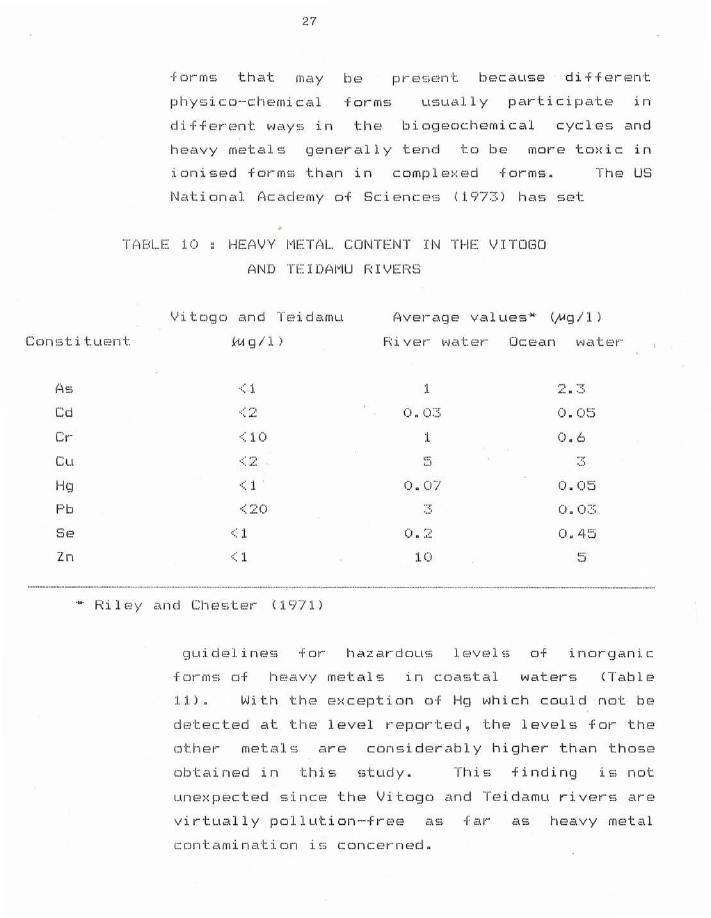
Table 10 gives the results
obtained together with the average concentration
of these metals in river and ocean wate rs.
of the heavy metals (Cd, Cr, Hg, Pb and
it was not possible with
the rt-?SOLlY-C8~:i
c:{ v ,,,\\ i 1 i:,\\ b 1 E·! to dr-:-1 tr.-?ct at or nf,?a1--··
conc:E:~nt1·- c\\t ions found in unpDlluted waters.
perhaps,; more important than the
mraa s ureme11t of the actual quality
distinction between the different physico-chemical

3.8 Page 28

▲back to top
27
f orms that may be present because different
physi c o-chemic a l
u s ua lly participate in
different ways in the biogeochemical cycles and
heavy metal s generall y tend to be more toxic in
ionised forms than in complexed forms.
Thf.:) US
Nat ional Academy of Sci e nce s (1973) ha s set
T(1BLE JO
HEAV Y METAL CONTENT IN THE VITDG
AND TE IDAMU RIVERS
Constituent
Vitogand Teidamu
A~,,
<1
Cd
<10
Cu
Hc;J
<1 .
Pb
<2()
Se
<1
Zn
<1
_ _ _,......~...............................~.
.... Ri 1 E·!Y c':\\r'l d Cl..lf::!f.:,tf"!r ( :I. 97 l)
Average values* (~g /1)
River water Ocean water
:L
o. o::::;
:I.
1_::_,
0.07
..,..-:...,. "_';,f
o. 0'.5
0. 6
0. 0~5
o. o:~:;
10
- - - - -............................................
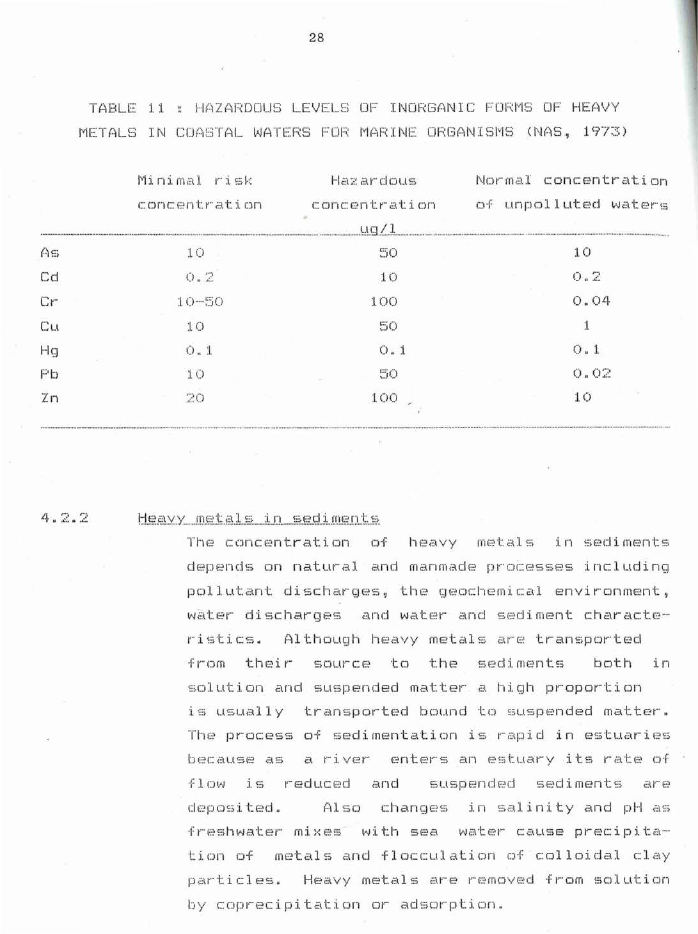
guidelines for hazardous l eve ls of
forms of h eavy met al s in coastal waters
1 l) . With the exception of Hg which could not be
detected at the level reported, the levels for the
ot her met a l s are consider ab ly higher than those
obtained in this stud y .
This finding is not
unexpected s in ce the Vitogo and Teidamu rivers a r e
v irtually pollution-free as far as heavy metal
contamin a tion is conc er ned.

3.9 Page 29

▲back to top
28
TABLE 11 : HAZARDOUS LEVELS OF INORGANIC FORMS OF HEAVY
METALS IN COA STAL WATERS FOR MARINE ORGANISMS (NAS, 1973)
1v1 in i ffl i':l l r·· :i. <,; 1-::
c: on c f2n tr··at ion
H El ;:.'. i,,\\ cl u u 1,;
c:onc:E•ntr-· at ion
Normal concentration
of unpolluted waters
()f.:i
:LO
Cd
0 . '.?
Ct·
:I. U···-~:.'iO
Cu
:1.0
Hg
0" :I.
F'b
iO
Zn
'..? 0
:lO
:1.00
;::iO
o, 1
~-"iO
100
:LO
0.04
1
0. l
0. 0'.."2
:1.0
1~:!.f.?PY.Y __n:1_qJ,.f:,:l l s; :i. n ___1,;,t;:.rU..ffl.("':.fJJ,..'i~
The concentration of hea vy me tal s in s ediments
depends on natural and manmade processes including
pollutant discharges 1 the geochemical environment 1
w~ter discharges and water and sediment characte-
ristics. Although heavy metals are transported
from their source to the sediments both in
s olution and suspended matter a high proportion
i s usually transported bound t s u s pended matter.
The process of sedimentation is rapid in estuaries
because as a ri ver enters an e s tuary its rate of
flow is reduced and suspend e d sed ime nt s are
deposited.
Also changes in s alinity and pH as
fre s hwater mixes with sea water c a use precipita-
tion of metals and flocculation of colloidal clay
particles. Heavy metals a re removed from solution
b y c precipitati n or adsorption .

3.10 Page 30

▲back to top
29
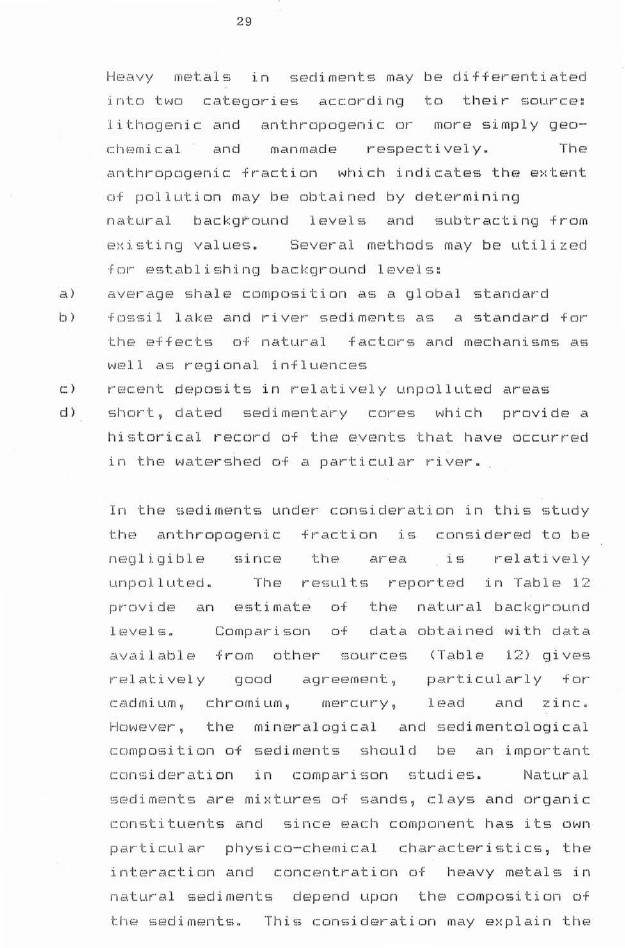
Heavy metals in sediments may be differentiated
int two categories according to their source:
lithogenic and anthropogenic or more simply geo-
chemical and manmade respectively.
The
anthropogenic fraction which indicates the extent
of pollution may be obtained by determining
natural backgtound level s and subtracting from
existing va lues. Several methods may be utilized
for establishing background levels:
a) average shale composition as a global standard
b) fossil lake and ri ver sediments as a standard for
the effects of natural factors and mechanisms as
well as regional influences
c) recent deposit s in relatively unpolluted areas
d) short, dated sediment~ry cores which provide a
historical record of the events that have occurred
in the watershed of a particular river.
In the sediments under consideration in this st udy
the anthropogenic fraction 1s consi dered to be
negligible since the area
is relatively
unpolluted.
The result s reported in Table 12
provide an estimate Cit the natural background
leve ls.
Comparison of data obtained with data
a va ilable from other sources (Table 12) gives
relatively good
particularly for
cadmium, chromium, mercury 1 lead and zinc.
However 1 the mineralogical and sedimentologi ca l
composition of sediments should be an important
consideration in comparison st udi es.
Natural
sediments are mixtures of sands, clays and organic
constituents and since each component has its own
particular physico-chemical characteristics, the
interaction and concentration of heavy metals in
natural sedi ment s d epend upon th e composition of
the sed iment s. This consideration may explain the

4 Pages 31-40

▲back to top

4.1 Page 31

▲back to top
30
e levated leve l s of copper, iron and manganese in
the Vi togo and Te id amu se diment s . Di s c:us s:i on o·'r
t he di s tribution of h eavy metal s in the different
components of sediments raises th e question on the
various forms in which the heavy metals are
presen t and th e ir bioavai lability.
Heavy rnl',,it i::1 l i,~
ma y be present in miner al crysta l lattices, as
TABLE 12: HEA VY ME TAL CONTENT OF SED IM ENTS IN THE VITOGO
AREA (re s ult s in mg / kg e xcept for Fe which is expressed as%)
VITU CCI
TE I D{.) l"IU
i:~ (•:~ c: e n t ,,,
:I.• LJ.-8. 4
Shellfish
area
Shellfi s h River
a r 6a
sediment
unp ol luted
aquatic
·······-···········-·············-·--·--·····-············-·············-·····........ ............. ..._..........._............................................... ··········-·-. ···. .···············s;.e.d .i ..rnr:!.n .t .s ._._.
2 .. 9--·14
:I. E:·•·- :I. ~:r.
Cc:I 1 . 2·-· :l . 7
<O. :I.
O .:LO-:l.::iO
:3s-ElEl
'.20-:l 90
Cu
96-···· l 50
f:3'.?-· :I. l 0
1.1.1.1
20--90
9.0 ·-- :L ~S
Hq
<0.2
Mn ~570-1400
:l 1 - 1 7
<0.2
r:;,:~:o•-2:20 0
7 . :~:••·· 11.
·100•··· 1 :~:o o
o. 09
1. 2-6.7
0" 15- l ::'iO
1.00-:lBOO
Pb 7. f:l·- :l 0
6.8-9.7
7 ~'i····9. 0
l :I.
1O··· :l 00
C•.>' e.
<0.:2
<(). 2
Zn
54--150
110-<220
f::,Cjl-J()O
5<) -·-~2!5()
a
1::,E?t 1~ ( 19E30)
b
Fo~stner and Wittmann (1979)

4.2 Page 32

▲back to top
4. 2. ::::;
31
precipitates or sorbed o nto v arious organic a nd
inorganic s ubstr ates.
The f1raction
l i:':\\tt iC:E?S C)f miner a ls i s not bi avai lable. For-
d eter mination of those fraction s rel evant for
geochemical biological processes vari ous leaching
procedures may b e utilized. In this s tud y the
( ac E:!t i c) c\\c: id e:-: trElct a b 1 e fraction
d cite1rmi ned.
Th i~,, . pn:JCE•i dur- e
m~?asur-es
thr.-:i
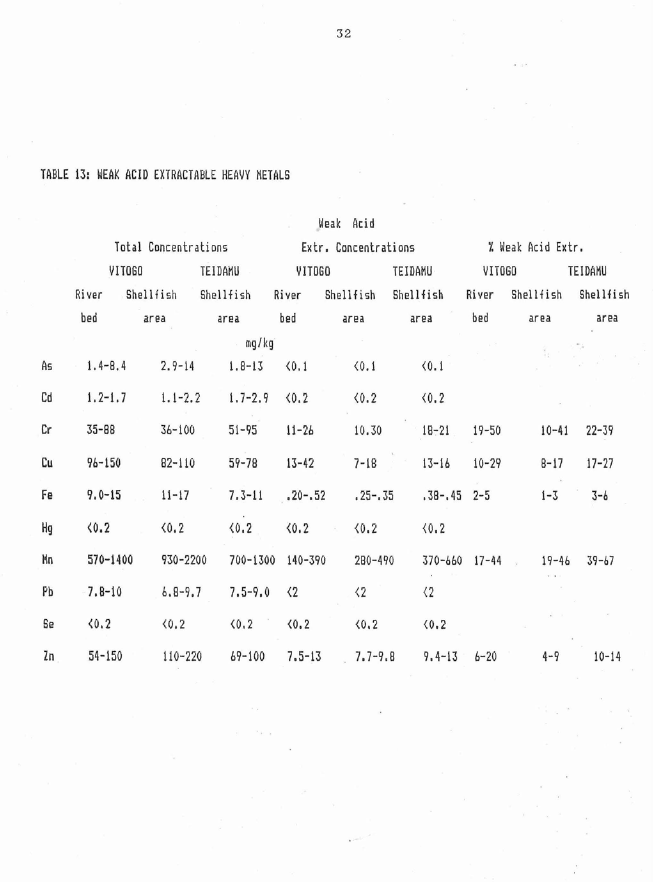
b :i. uc:1Vi:\\i l i:.'lb 1 e fr·ac:tior1 thDLI(Jht to be assoc:i. at.F1d
wi th car-bonates, h y dr o u s iron and manganese oxid e s
an d organic molecul e s . Res ult s are r epo rt ed in
Ta ble 13 which s how t h at up to 50% (Cr- and Mn ) of
the t o tal metal cont en t can
in
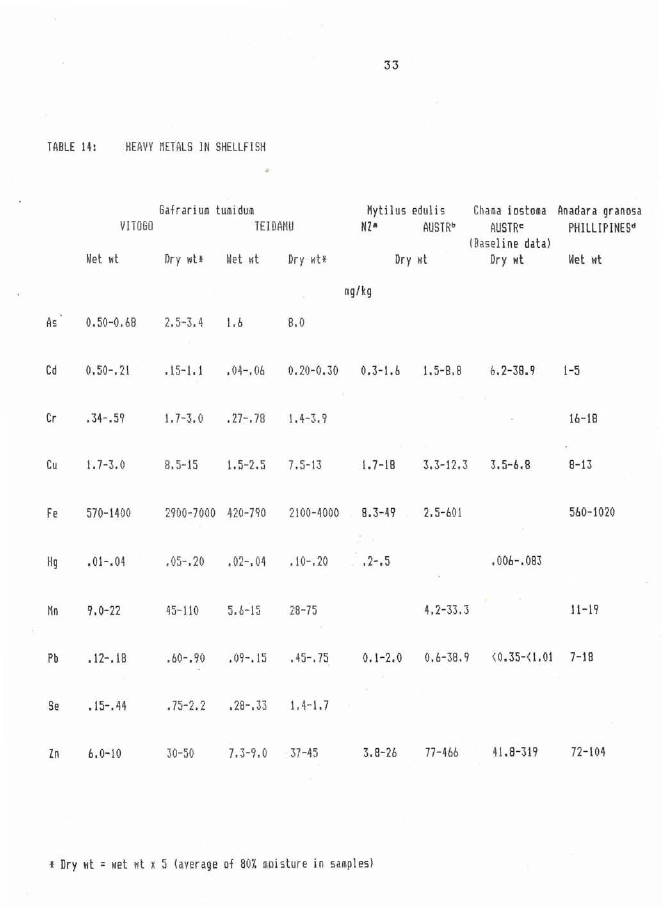
pote ntially bioav ai l abl .e forms.
Hc·!.<::1.vy .....mci.t.i::l l ..~"······i .n....s>hE:•l.l .+i.f::>h.
Th e tot a l ~eavy metal content of the she ll fish
samples is given in Tabl e 14 .
Data for other
bi va lve samples obtained by various other worker s
:i. 1,:, i r-1c l uded.
a ) Nielsen and Nat han ( 197 5)
b) Fabr··i!3 et al (:l97U)
c) Burdon-Jones a n d Denton (1 904)
d)
Hun <Jsp r e ug s (19 U'.':'i)
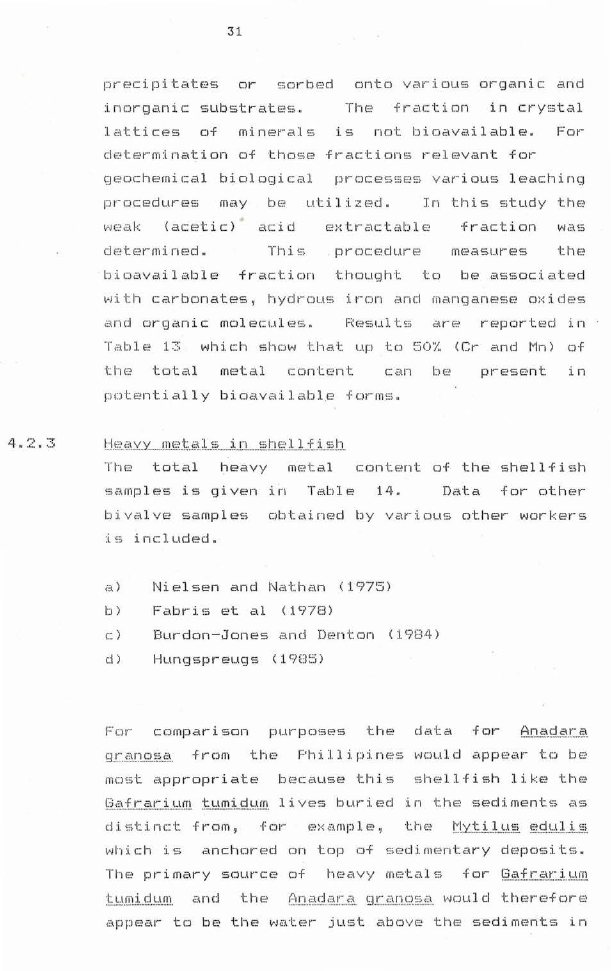
r:·cw comparis on pi_wp o!3(·?S; thE! data fOlr A.n.a.d.ar-a.
q_,,....,,\\nC:i.1'\\<'::\\. ·f 1'- Dm th P F'h :i. 11 :i. p :i. n ei,; \\•Jou 1 d clp p E-)av- t o be
mst appropriate beca u se this s h e llfish like the
(3.a.f..t-.a,r.i.um tumidum l:i. Y0?S hL.uried in th02 se diment s ais
+ cl i ,,,, ti n c:: t fr- om?
cw· f::i :-: .::,unp l E! ·i th"" My t i)_u s; E:id u l i i:;
whic h is anc:hor-ed on top of sedimentary d e posits.
Th E! rw i ma r- y so ur Ct:,) of h(·:?,::1Vy met a l S f or G.i::\\.f. 1r.c,.r- .it.l.m
tt.t_rn:i...clum. E1nd thr:~ P1n.,,:\\C:IE:\\.l'".c'.1. q 1r· .;::1n c:>.<::,E:\\. ~'JCiUl cJ thE:': r-e-:f ore
a ppear to be the wa t er ju s t above the sediments in

4.3 Page 33

▲back to top
32
TABLE 13: WEAK ACID EXTRACTABLE HEAVY METALS
Weak Acid
Total Concentrations
Extr. Concentrations
'l. Weak Acid Extr,
VITOGO
TEIDAHU
VITOGO
TEIDAMU
VITOGO
TEIDAHU
River Shellfish Shellfish River Shellfish Shellfish River Shel Iii sh Shellfish
bed
area
area
bed
area
area
bed
area
area
mg/kg
As 1. 4-8. 4 2.9-l4 1.8-13 (0, 1
<0.1
(0, 1
Cd 1.2-1. 7 1.1-2.2 1.7-2.9 (0.2
(0,2
(0,2
Cr 35-88
36-100 51-95 11-26
10,30
1B-21 19-50
10-41 22-39
Cu 96-150
82-110 59-78 13-42
7-1B
13-16 10-29
B-17 17-27
Fe 9.0-15
11-17
7.3-11 .20-,52 ,25-.35 ,3B-,45 2-5
1-3 3-6
Hg <0.2
(0,2
(0,2 <0.2
{0,2
{0.2
Mn 570-1400 930-2200 700-1300 140-390 2B0-490 370-660 17-44
19-46 39-67
Pb 7,B-10
6,8-9 .7 7.5-9.0 {2
<2
{2
Se <0.2
(0,2
(0,2 (0,2
(0,2
(0.2
Zn 54-150
110-220 69-100 7.5-13 7.7-9.8 9.4-13 6-20
4-9 10-14

4.4 Page 34

▲back to top
33
TABLE 14: HEAVY METALS lN SHELLFISH
Gafrarium tumidum
VITO GO
TEIDAMU
Wet wt
Dry rill Wet wt Dry wt*
Mytilus edulis
NZ•
AUSTRb
Dry wt
Chama iostoma Anadara granosa
AUSTRC
PHILLIPINESd
!Baseline data)
Dry wt
Wet wt
mg/kg
As 0.50-0.68 2.5-3.4 1.6
8.0
Cd 0.50-.21
.15-1. 1 ,04-.(16 0.20-0.30 0. 3-l.6 1. 5-8, B 6.2-38.9 1-5
Cr .34-.59
1.7-3.0 .27-.78 1.4-3.9
16-18
Cu 1. 7-3.0
B.5-15 l.5-2.5 7.5-13
l. 7-LB 3.3-1 2.3 3.5-6.8
8-13
Fe 570-1400 2900-7000 420-790 2100-4000 8.3-49 2.5-601
560-1020
Hg .01-.04
.05-.20 .02-.04 .10-. 20 .2-.5
.006 -.083
Mn 9. 0-22
Pb •12-.18
GS-110 5.6-15 28-75
4.2-33.3
11-19
.60-.90 .09-. 15 .45-.75 o. 1-2. 0 0.6-38.9 <0.35-(1.01 7-18
Se .15-. 44
.75-2.2 .28-.33 1.H.7
Zn 6.0-10
30-50 7.3-9.0 37-45
3.8-26 77-466 41.8-319 72-104
* Dry wt= wet wt x 5 (average of BOZ moisture in samples )

4.5 Page 35

▲back to top
34
~,1h i c::h they
Thei1--
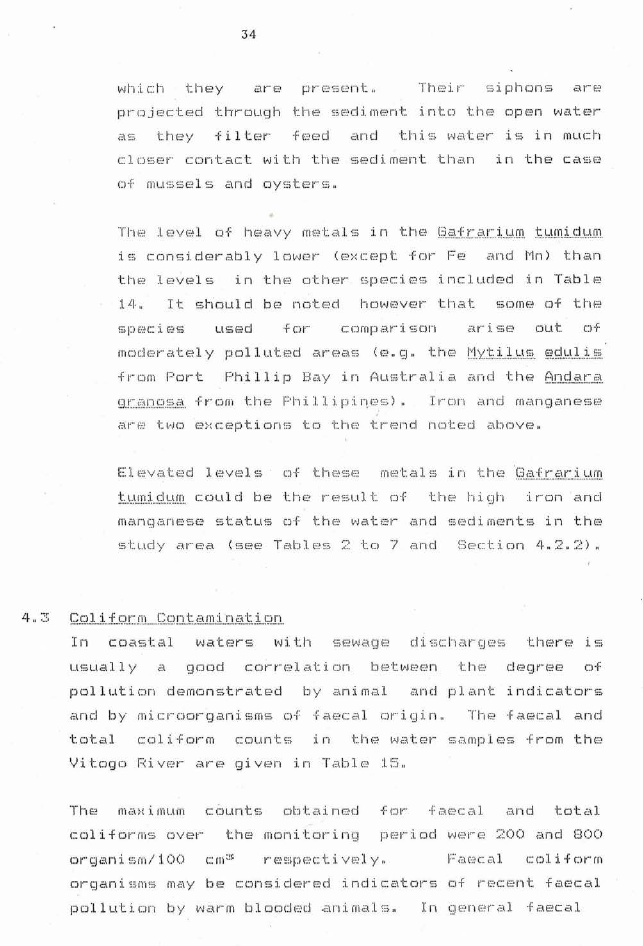
projected through the sediment intthe open water
i::lS:i thciy -1: i 1 t0?1r•
this water is in much
closer contact with the sediment than in thE• cr:\\o:;r.-?
of mussels and oysters.
ThEi l c1vci l u+ h0~i,,l'✓ Y m02ti,\\l <::; :i. n the U:'c.\\:Lr:.Pc.tqr.n :t1,.1m_t~J1.::1.p}
is considerably lower (except for Fe a nd Mn) than
the levels in the other species included in Table
:l 'I·. I t Ehnul cl b t?. not. r-::-:d t h Dl•Jf,?.VEir.. th El ~;omf.-:1 of th H
species used for comparison arise out of
t mC) c:I F:! I'" E:\\ , ::: 1 y p D l 1 u t (7?. d c\\l"' ('£! c:\\ ~, ( E·! " g " t l"'1 0? y 1··11 ti) _,U!::',. edul.i . f.";_
from Port Phillip Bay in Australia and the Andara
Iron and manganese
are two exceptions t the trend not ed above.
t.,urn:i.. c:lt.1,rn c:oul cl b('? the l''C)\\::\\L.ll -1::. of thr' hicJh :i. r.. on ;,,l n cl
mang anese status of the water and sediments in the
study area (see Tables 2 to 7 and bec:tion 4.2.'.?).
L~" :::. Co.l ..:L,+_c:w ,m.. ,Cc>nt..<::l_ffl :i.r)_i::it. i __c:;n,
In coas tal waters with sewage di scharges
usually a good correlation between the degree of
poll u tion demonstrat e d by animal and plant indicators
and by microorganisms of faecal origin. The faecal and
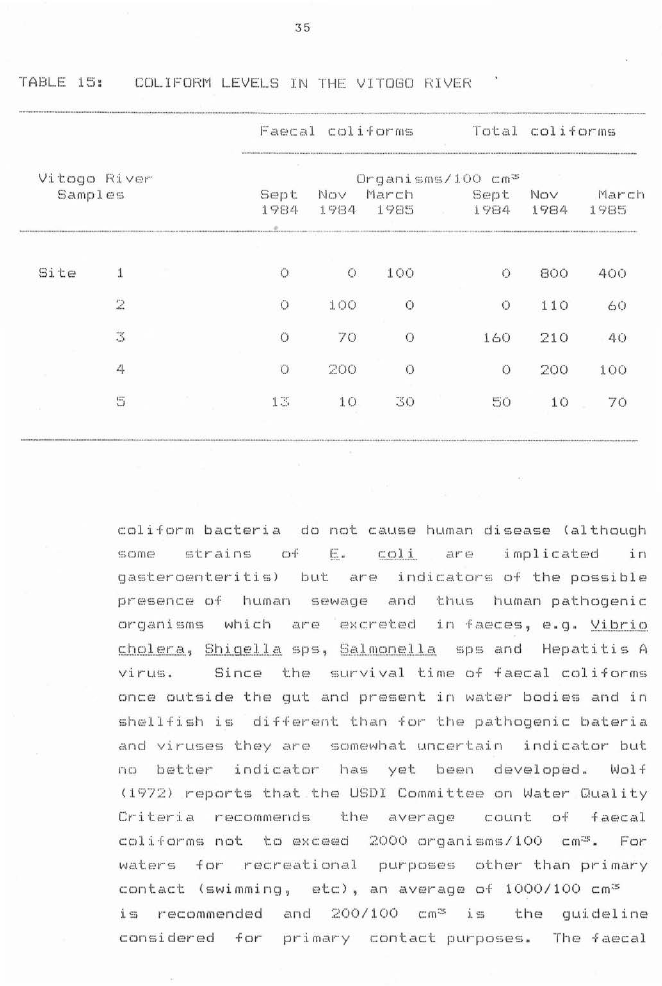
total co liform counts in the water samples from the
VitogRiver are gi ven in Table 15.
The maximum counts obtained +cw· -f i:'i. (:·? C i::'l 1 and t o t a l
coli.forms over the monitoring period were 200 and 800
organism/100 c:m 3 respecti ve l y.
Faecal coliform
organisms may be considered indicators of recent faecal
pollution by warm blooded animals. In general faecal

4.6 Page 36

▲back to top
35
COLIFORM
_ __ ······-··-···..·······-····..···•...............-.....................................
LEVELS IN THE VITO GO RIVER
_ __ .....................-........................................................................................,,....... ............................................
+ F i~\\E'C Et l c:: Cl l i or- m~:;
Totc1l col ifc.1r-m ~:;
Vi togD Fii vc-) 1--·
t:;c:\\ mp 1 c·:,11,;
bc-:,ipt
:l 9Ht.J.
rganisms/100 cm3
I\\Jo v l"l c\\ l'. ch
UEc p t
:l.9H4 :l 9H'..'.'i
1 9H'-1·
Nov
1 C/El/.J.
M,,,1r- c h
:I. c;•u~.:i
Site
1
4
1:::·
··-'
0
0
:I. 00
0
:1.00
0
0
70
0
u
200
0
:LO
0
0
:1.60
0
EiOO
110
210
'.ZOO
10
400
60
f.J.O
:I.OU
70
·········-·--·····--······-···-·········-···-·--············································ ·········-·········-····-···················-•················································-·--······-······-·············-·············-············-············- - --·...·-··············-·······..·············--·····-·······--
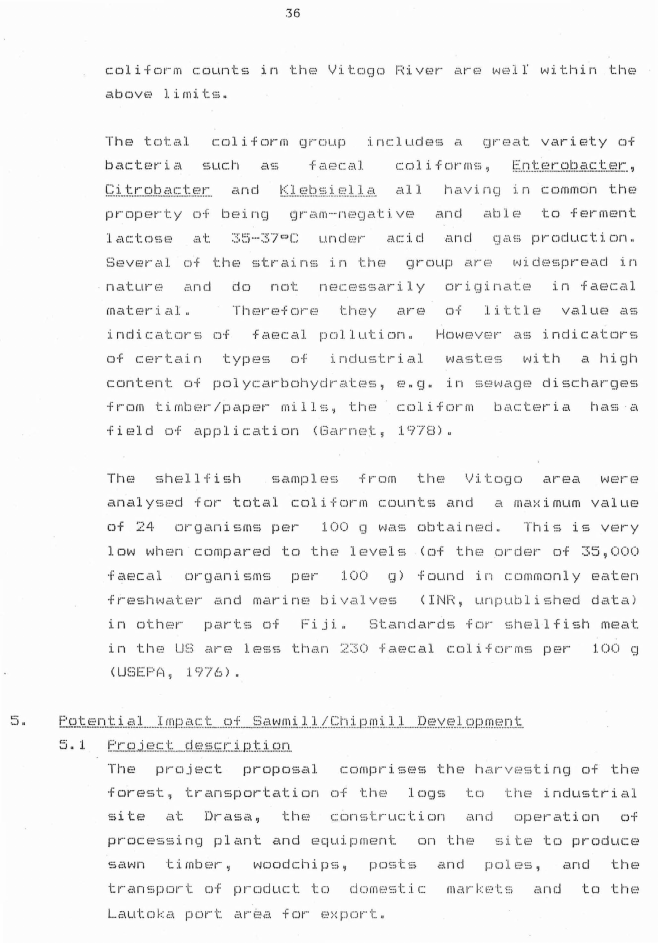
coliform bc1cteria do not cause huma n disease (although
uf
c::. o.1 ..:i... i::\\ ,,. C:::'
implic:c:'1tE•cl
in
gasterenteriti s ) but are indicators of the possible
human s e wage a nd thus human pathogenic
vi r-L.li,i,,
Since the s urvival time of faecal colifc.1rms
once outside the gut and present in water bodies a nd in
shellfish is diff e rent th a n for th e pathogenic bateria
and vi ru ses they are somewhat uncertain i ndi Ci:ittc.11·-· but
nu hettr;:!t... 1nd1cator h as yet been developed. l•Jol f
(19 72 ) reports that the UBDI Committee on Water Quality
Criteria recommend s
t h C' c":\\ V F?. 1··•· ii:\\ (J ('-'.-\\
coliforms not to exceed 2000 rganisms/100
cm 3
For
waters for recreational purposes other than primary
contact (swimming 1 etc)? an average of 1000/100 cm3
1s recommended and 200/100 cm 3 is thEi C::Jl..t:i. d E-~1 i nE:1
considered for primar y contact purposes.

4.7 Page 37

▲back to top
36
co li form count s in the VitgRi ver are welr withi n the
,:1bovr,1 limit.i:;; .
..1· 1·1e .t... Cl .t.. ,:"L·1 C::<Jlifo1'· m gi""'·uup includes a great variety of
C.i. tr-.0.b.E:1.c.t.ra_r...
,::\\n cl
l<l.E·)b ~,;.:i..c)l).a
co li + c:it·.. m!::; , E......r...1....t...r...:..:..!...r_......-ba-c-t e-. 1~'
,''l .I. .1. ha ving in common the
property of being gram-negative and E1blF~ to +erment
l c.·,, c:: t o ~,; (-:.;i t,,,, ::::;\\'.':i ..... ::::: 7 "" C u n cl E·i I'.. i:':\\C l c:i i::\\ l..l cl q,::11;;; production .
Several of the strains in the group are widespread in
natu1·-E' 2\\ n c:I c:lo not neces sar ily originat e in ·f c\\l:-?C i::\\ 1
matr:21'. :i.dl ..
littlE• value:i ,::\\=,;
DTI' f i:\\['ic:::2,11 pullution .
of ce1·-ta:i n typ1;1~; of i nc:lu i;,;t1~ i c\\l
a hi <;.Jh
content of polycarbhydr ates, e.g. in sewage discharges
from timber/paper mills, the col i furm bacteria has a
f i eld of applicati o n (Ga rn s~, 1978).
the Vit go area were
analysed for total coliform counts and E1 mi::1:-: i mum v ,-::\\ 1 u ,0
of 24 organisms per 100 g was obtained. This is very
low when compared to the l evels (of the order of 35i000
+i::\\E)Ci:\\l
100 g) fo und in commonly eaten
freshwater and marine bi valves <INR, unpublished data)
in oth<;:11'.. p i::\\ t 1:5 D-f 1:· i j i . Stan dards for shel lfish meat
in the LJ S are l ess than 230 faeca l c lifurm s per lO O g
:"i.. F'ot E;.n.t i .:,\\ l........Irr1p.,:,1c::t. ....Cl:f....... b,,,,.v-Jn1.:L..l. l ../.C.h.:i. prn i)J..... . .D.<e:•:•.v.<-:::•.lop m.r.·:·)n.t_
5 .. J.
1::•r o,J.E•c:. t . . . ci.E:.1::;.c:: .1'...:i.P t .:i...ci.n
Th e p1,·oj E)Ct
comprises the har ves ting of the
forest, transportation o+ the l egs t the industrial
site at D1~i:',\\Si:',1? the construction ,,,,nd Dpr:!1·-ati <Jn of
processing plant and equipment on the site to proc:luc::e
sav-m t :i. mb ci1~ , v-modchi ps; 1 pci~-:;t ·,.; and pol r0s 1 1:,, n d
transport of product to domestic market s and to t h e
Lautoka port ar~a for export .

4.8 Page 38

▲back to top
37
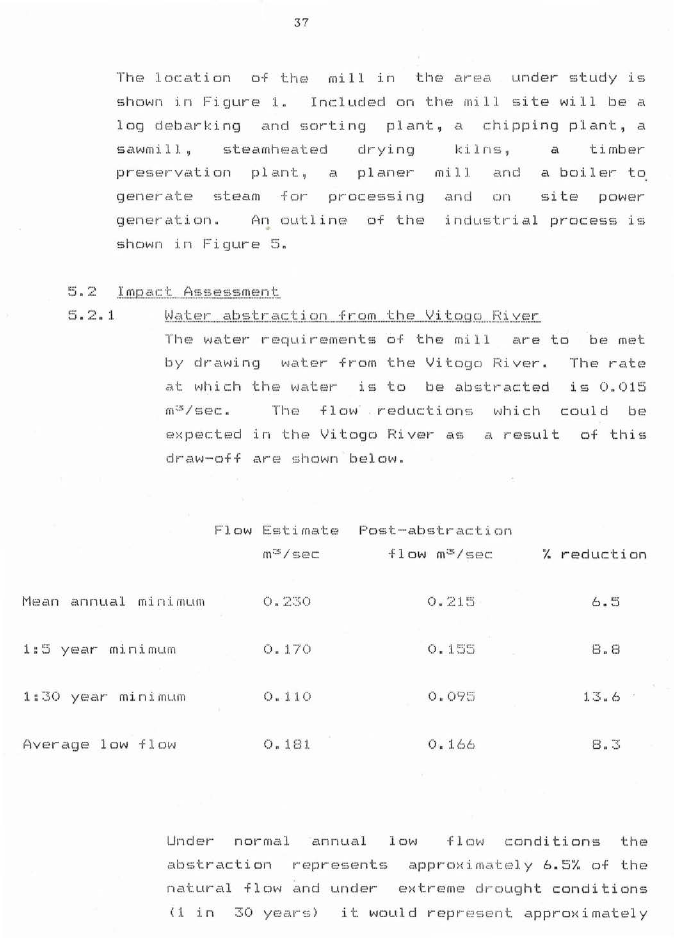
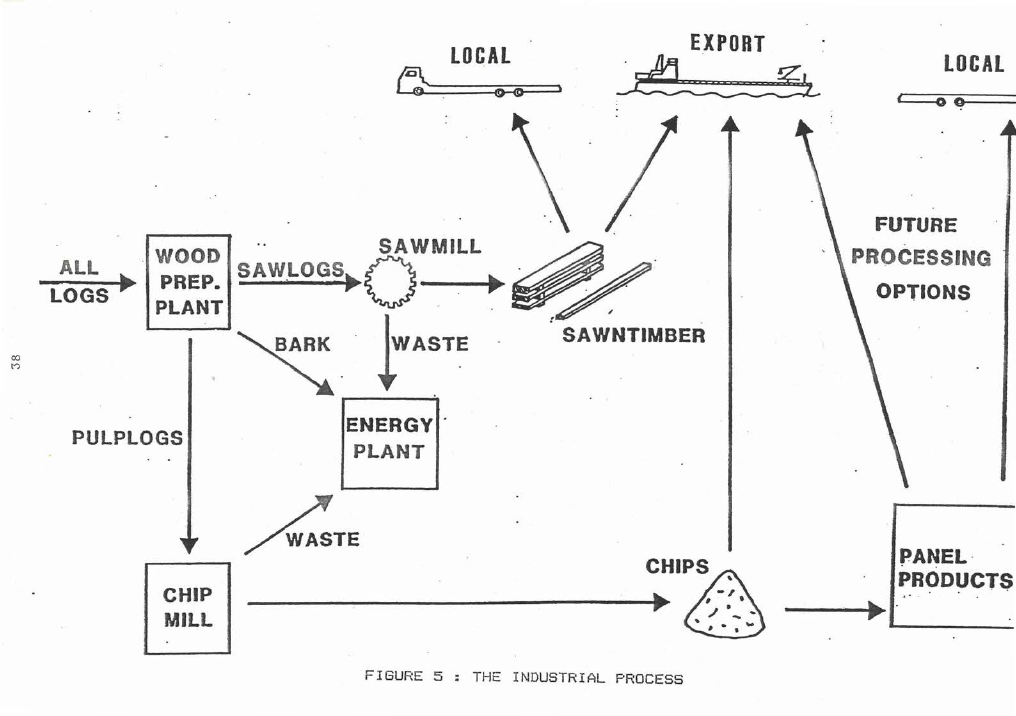
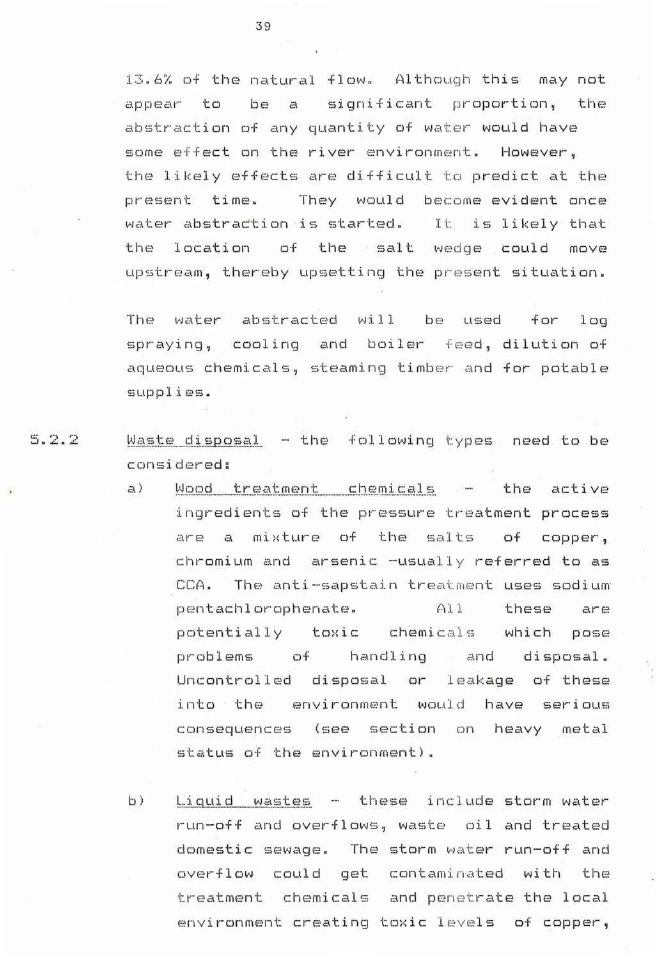
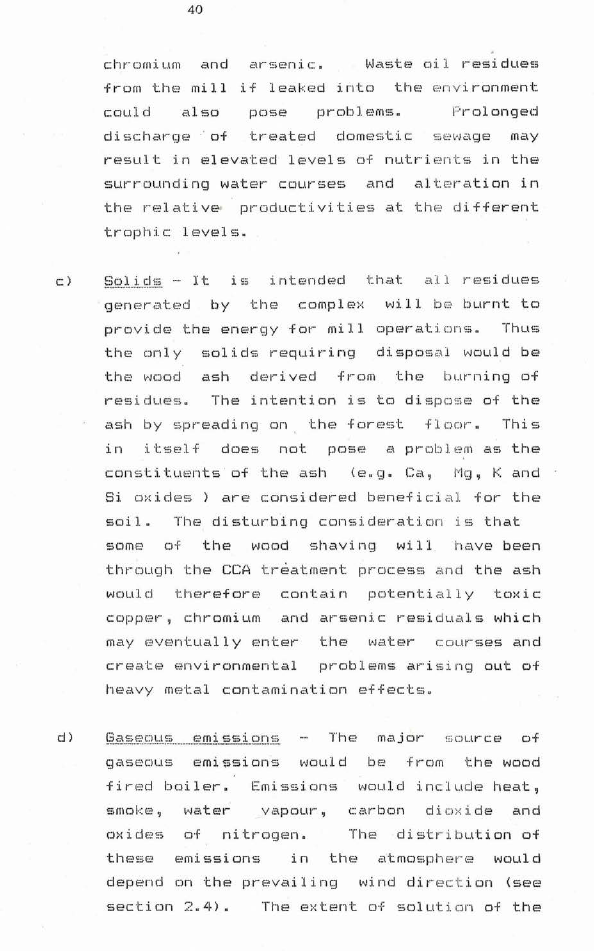
The location of the mill in the area under study is
shown in Figure 1. Included on the mill site will be a
log debarking and sorting plant, a chipping plant, a
sawmill~ steamheated drying
kilns~
a timber
preservation plant~
genf:?1·-·ate;;: ~;,tE?am +oi----
a planer mill and
pir·ocessi n<J ,,,1n c:I on
a boiler to
<J E~n £01---· ,,,it :i. on. r.:.,n outline of the:-? industrial process is
shown :i.n Figure 5.
~s. 2. :1.
l;J_i:':\\_t _E)_I"'' .......ab S:,_t1---· _i':1c:: _t _i Cl n f t"' o _m_______t _h .f:"'.......V.:i.,tC),(]_Ci_____J~.i _V ,f!2_1r
The water requirements of the mill are to be met
by drawing wa ter from the Vitog River. The rate
at which the water is to be abstracted is 0.015
m3 /sec.
The flow ·. reductions which could be
expected in the Vitogo River as a result of this
draw-off are s hown below.
Flow Estimate Post-abstraction
m::!!'/sec
f 1 o~..., m':!!: I s c'? c
'1/. r-educti on
Mean an n ual minimum
:L: 5 yr~ar- mini mum
:1.:30 year minimum
0. :I. 'JO
o. l 10
o. :1. ~'i:i
o . 09 '.','.'i
El. 8
0. :I. El I.
0. :1.6 6
8. :~;
Un elf.JI'"
annual low flow conditions th{?.
represents approximately 6.5% of t.hE!
natural flow and under extreme drought conditions
(1 in 30 years) it would repre sent approximately

4.9 Page 39

▲back to top
LO~AL
EXPORT
~
o . r · . WOOD
SAWMILL ~
.
ALL
SAW_LOGS
LOGS
PPLRAENPT.
-
.
.
.
~ - . ! WASTE
'SAw'NTIMBER
CX)
t')
PULPLOGS
ENERGY.
PLANT
-
LOCAL
1
FUTURE
PROCESSING
OPTIONS
CHIP
MILL
FIGURE 5: THE INDUSTRIAL PROCESS
PANEL ·
•· PRODUCTS

4.10 Page 40

▲back to top
1::· , .._.. ,.,
.._, • .a:.. • •a:..
39
13.6% of the natural flow. Alth o u g h this may not
to bE1 a significant p1~oporti on,
abstr a ction of any quantity of wa t e r would have
some effect on the river e nvironme nt. However,
the likely effects are difficult t o predict at the
timE!.
They would b eco me evident once
water abstraction is started. .l. t is likely that
the:i location o·f the salt we d ge could move
upstream, thereby upsetting the pr esent situation.
ab~;;tracted
b E~ used
1 og
~,; p I'"' c:\\ y :i. n g , c o o l i n g
teed, dilution of
aqueous chemic a ls, steaming timb er a nd for potable
~, upplir.=s.
W_,':\\_~:;t _E•.......d .i . s p O !:-~i:'1]. - th e following ty pes need to be
c cinsi dered:
a) l;-JDc:J_cj ________ tr _r:,!/:\\_t m_Ei n.t............... ch.f':! mi _c: al _ ~;_
the active
ingredients of the pressure t reatment process
a re a mixture of the s ,,,\\lt ~s of copper,
chromium a nd arsenic -usuall y referred to as
cu~. The anti-sapst a in tre atme nt uses sodium
pentachlorophenate.
(.) 1 1
these are
potentially tm:ic chemi c.,,\\].~; which
r.:wob l r.=ms
of
handling
d l7d disposal.
Unc::ont~-·ol l eel disposal
l ea kage of these
into thf,? environm e nt would have ser·i ous
consequenc e s (see s ection c::i n heavy metal
status of the environment).
b) L..:i._qui d _vJ_<,:l_~:>t _E-":i~:;
th ese in cl ude storm water
run-off and overflows? waste o il and treated
clomest i c sev~age. Th e storm wat er run-off and
get cont.ami n ,':\\ted with th£:!
tr··e atme17t chemical s and pen e trate the local
environment creating toxic l eve ls of copper,

5 Pages 41-50

▲back to top

5.1 Page 41

▲back to top
40
chr-omi um and i::\\rsen :i. c:.
Waste oil residues
from the mill if leaked into the en v ironment
could also pose
F•1rol onged
discharge · of treated domestic sewage may
result in elevated levels of nutrients in the
surrounding water courses and alt e ration in
the relative productivities at th e different
trophic levels.
c)
t:>,D)_:i. _d_i:0,
It
:i. n ten cJ E~d th;.·,\\ t.
by the c:omple:-: ~-Ji 11 b e::• burnt to
provide the energy for mill operations. Thuis
the only solids requiring disposa l would be
the wood ash derived from the burning of
resi duf2f::;. The intention is to dispose of the
by ~;pr-eadi ng on thE! f DrE!st 1 -f C)C)('"" " This
in itself does not pose a problem as the
constituents of the ash (e.g. Ca,
Si oxides) are considered benefici a l for the
soil. The disturb~ng consideration is that
some of the wood shaving will . have been
through the CCA tr~atment process and the ash
would therefore contain potentially toxic
copper, chromium and arsenic residuals which
may eventually enter the water c:our-ses and
create environmental problems ari s ing out of
heavy metal contamination effects.
d)
(3 ;,,\\ sE1Ci_t..l s __,________C=-' mi s s i on i,;
Thf2 m,,,\\ j or
gaseous emissions would be -from the wood
fir <01d boiler. Emissions would include heat,
E',moke,
carbon di o>: i de and
nitrogen.
The distribution of
thf2SE·! emissions in the atmosphere would
depend on the prevailing wind direction (see
SfJC ti on 2 .. 4) . The extent of solution of the

5.2 Page 42

▲back to top
41
r,imis;sions; in rainf a ll and e ntry into the
Vitogo and Teidamu rivers is uncertain.
5. :2:: P,r·_cipo_�,.o°: l).. ...+. 0.1·-.....M.:.iJ:..i.<J.c:\\.t.:.i..o.n. .....o.+...J:: {+f:::!.c::t.fc;.
a) Stringent control measures need t□ be exercised in
the treatment plants to contain all spillages and
d1r• i p"';. . The m�nagement have taken this point into
consideration and an assurance has been obtained
that if there is any build up of chemical sludge
which requires to be removed and dispor..;ed , it .
would be drummed and returned to the supplier for
reprocessing or neutralising.
b) Provisions for appropriate drainage of storm water
n eed to be made so that contact with tm:ic:
treatment chemicals :i. �;; pt-evented .. This pr-oposal
has already been considered and several concrete
drains chanelling storm water into the Nawawa Vise
Creek of the Teidamu River have been constructed
on the� �:;ite.
It has been con-firmed that no
e+ + l uE�1--1 t o·f any description would be disposed of
int□ the stormwater system. H□wevF�r· 1 taking into
21ccount any unintentional leakage of treatment
chemicals into the system, the Department of Town
and Country Planning of the Fiji Governm�nt with
ad v ice from INR, has made it a requirement that
all cl :i. s:,chat-ges into Teidamu River.or any other
water courses shall conform to the following
gUicJ E:� 1 :i. nE?S l
Coppf!', r c:ontf.-?nt
Total Chromium content
Ch1r·omiL1m (VI) content
h1··-sr: .inic cont.E•int
LO mull
:·� • C) 1 ffl(J /
o. �i m�J /1
() lf !:j m<;J I l
.I. t was al. so noted that the s·t_·orm w�Pt-c1r drains to

5.3 Page 43

▲back to top
42
the north into the Teidamu River a nd no drainage
is ch a nnelled into the Vit go River fr om the mill
site.
In view of this the manag ement has been
asked to commission a small scale baseline study
of th e Teidamu River.
c) To pr event treated wood sh a vings be i ng burnt, all
treatme nt should be deferred un til planing
operations are completed. This prop osal has been
accept e d by the management which mea ns that all
shavings that are burnt in the boil e r plant would
be
free
from
wood
treatme nt chemical
contamination.
6. Conclusions
A baseline study on the quality of the Vit go River and
associated area has been completed. It woul d appear from
this report that although the sawmill/~hipmill c onstruction
is likely to af fe ct the environment in a numb e r of ways, a
lot of emphasis has been placed on water qualit y of the
area. It should be noted, however that a base ! ine study is
primarily a ben c hmark for the future; it need neither be
extensive nor all-inclusive. What it should s trive for is
to measure the baseline levels of those e nvironmental
parameters that are going to be most af fe cted by the
development and are important for imp a ct assess ment.
In the case of this study water quality was con s idered to be
most vulnerable to the planned development. The findings
show that this aspect of the environment is relatively
uncontaminated a t th e present time. With soun d p lanning and
management of the sawmill/chipmill c omplex th e development
need not have a significant impact on the envir onment.
The authorities concerned with the developme nt have been
extremely co-operative and agreed to consider the proposals
made (in Section 5.3) for mitigation of likely e f fects.

5.4 Page 44

▲back to top
43
However, the true extent of the impact of the development on
the quality of the environment will become apparent once the
mill becomes operational.
Some future monitoring is
required for quantification of any impact.

5.5 Page 45

▲back to top
44
F'ub 1 i c Hr!al th Association / American Water- Work,:.;
Association/Water F'ol l uti on Cont 1···01 ~,si;;;oci ati on. 1981.
Standard methods for ecamination of water and wastewater.
ISBN~ 0-87553-091-5.
Bartholomew, R.W. 19~:i9. Geology of the Lautoka Area; North-west
Viti LfNLl. Geological Survey Department, Suva, Fiji.
Burdon-Jones, C. and G.R.W. Denton.
l 9H LJ.
organisms from the Gt Barrier Reef
Metals in marine
Pt- vi nee.
Baseline survey.
James Cook University, Tovmsvi 11 e ~
Austr-alia.
Cawthron Technical Group. 1984. En~ironmental Impact Assessment
of a Proposal to Establish an integrated sawmill/chipmill
complex at Drasa, Western Viti Levu, Fiji.
Fabr-is, G.J., Harr-is, J.E. and F.A. Tawfik. :L97f3. Hec\\VY metals
in t.hE~ mu~:;~;E01 t1yti1us i0~d ul..i. ~5. pl _~u,uJ f \\t_u<;:.; +r-·.om Port Phillip
and Corio Bays.
Repot-t No. Z?O .. Environmental Studies
Se,~i es. Ministry of Conser-vat.ion, Victoria, Austr-alia.
For-stner-, U. and G.T.W. Wittmann. 1.979. Metal Pollution in the
Aquatic Environment. Springer-Verlag, Berlin.
Gar-r-els, i::;:. M. c:\\nd F.T. i"lac ken z i E•.
Origin of chemical
compositions of some springs and lakes.
_I n.~ Equi 1 ibr·iLUn
Concepts in Natural Water Systems. Advances in Chemistr-y
Series ' 6···-·7---? 222-242.
Hungsp1'·euqs ~ i"I. l 9U~5. Marine pollution b y heavy metals in the
East Asian Seas Region. .I.n.~ Environment and Resources in
the Pacific:. UNEP Regional Seas Reports and Studies No. 69.

5.6 Page 46

▲back to top
45
,_ E.' s 1 i e 'I D n 11 • ' N2\\ k a 1 an i ? I< " ' To1~a, T ..
t~. J"
Soils of the Fiji Pine Forests.
III. Soils of the Lololo Forest.
Environmental Studies
F~E-?p or·· t
No ..
26,
InstitutP o+
The
University of the South Pacific , Suva, Fiji, 53 pp.
N.A.S. (Naticinal (-kademy of bcirincE·?f:;) ..
tiJater· ()ual i ty
Criteia, 1972 Report of Committee on Water Quality Criteria.
National Academy o+ Sciences, Wa s hington, D.C.
Nielsen, S.A. and A. Nathan.
mc>l 1 u i,;c:~;;. N" Z ..
197:.':i.
Heavy metals in New Zealand
,.9.•.., 467-··AB 1.
Petr·, T.
Purari River Environment (Papua New Guinea). {-'1
summary report of research and survey during 1977-1979.
Office of Environment and Conservation and Department of
Minerals and Energy. Papua New Guinea.
Riley, J.P. and R. Chester. ·
:l 971 ..
Introduction to Marine
Chemi s;try. Academic Press, New Yo rk and London.
Sh arm.:~, S. ~:::. 1982. Climate of the Nadi Region, Fiji. Fiji
Meterological Service, Technical Notes No. 16.
£3tonef i sh Co. Ltd.
:I. c_rn;~; n
on a preliminary
i nvesb. gat ion of Vitogo River on likely effects of
continuous ~xtraction of water.
Twyford, I.T. and Wright, A.C.S. :I. '/65. Soil Resources of the
Government Printer, Suva.
US Envi rcmment2\\l Protection Agency .
Washington, D.C.
l 976.
Quality criteria fer

5.7 Page 47

▲back to top
46
Wolf, H.W. 1972.
quality.
l'1 i ct-ob i .o lo(~ Y.
CoJi+ot- m c:ount ,::\\ ~:; <':\\
r:~.
Mi tc::hE:111 ( Ed).
Wiley lntersc::ienc e.
measure of water
l>J..:;,lter.._.....f'c:iJ.)._ u_t i _un