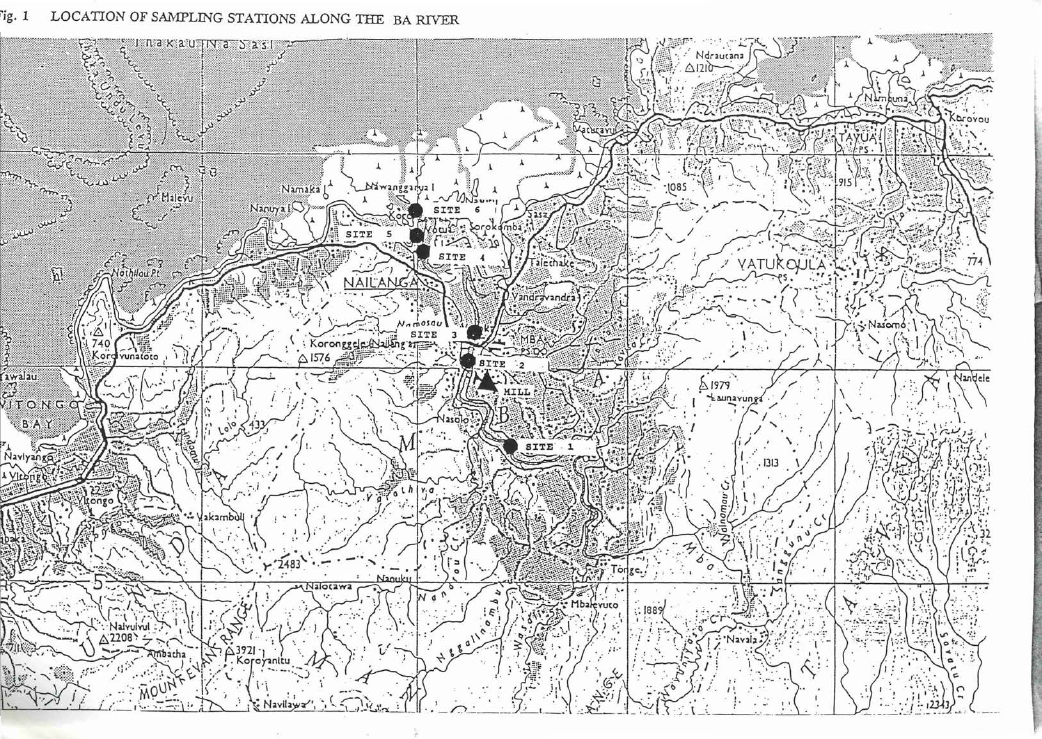
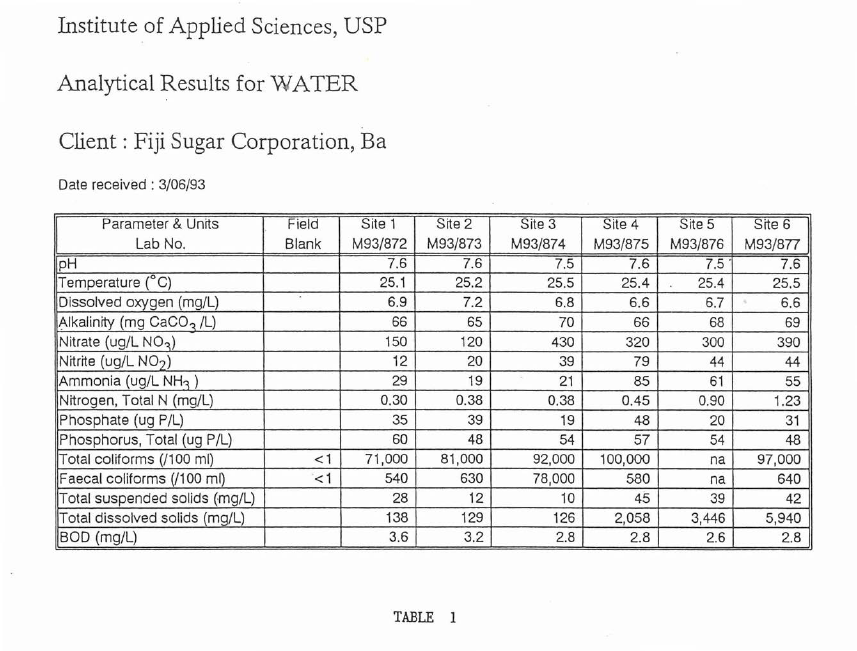
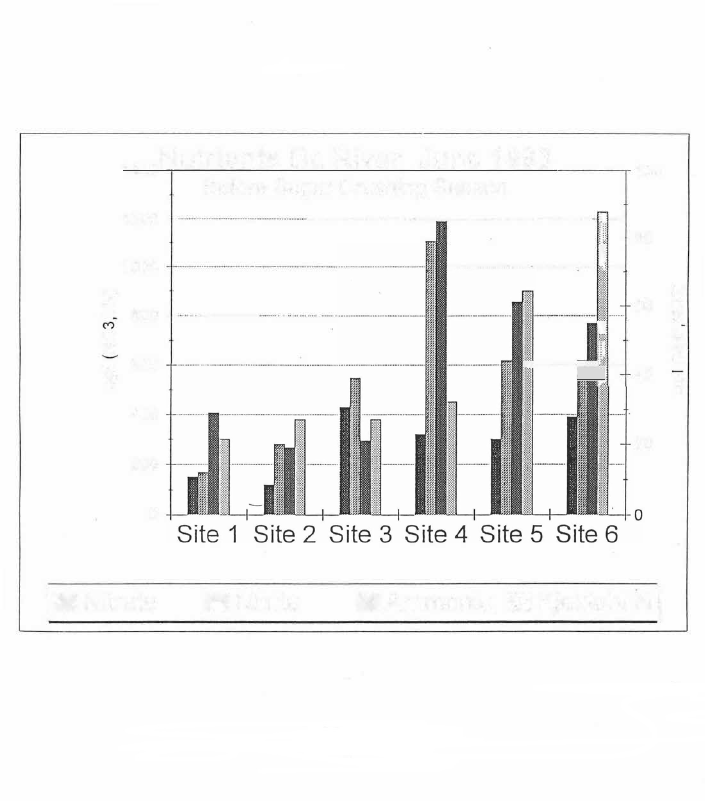
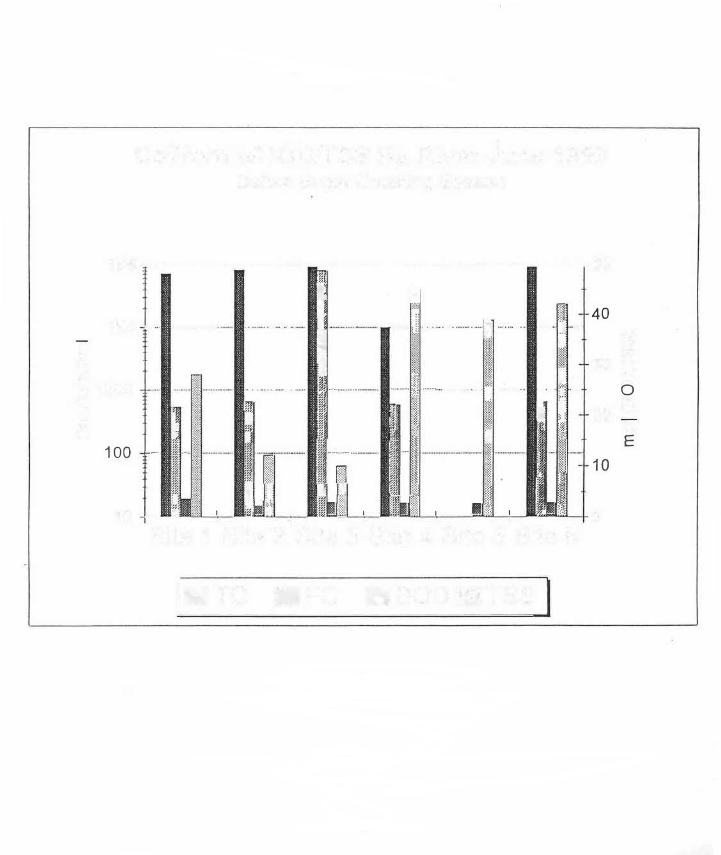
water quality assessment in the Ba river

1 Pages 1-10

▲back to top

1.1 Page 1

▲back to top
INSTITUTE OF APPLIED SCIENCES
THE UNIVERSITY OF THE SOUTH PACIFIC
WATER QUALITY ASSESSMENT
IN THE BA RIVER
(BASELINE REPORT)
IAS ENVIRONMENTAL REPORT NO. 68
by
Bale R. Tamata, M.Env.Stud.
Sereana Kubuabola, MSc.

1.2 Page 2

▲back to top
INTRODUCTION
The Institute of Applied Sciences (IAS), USP was contracted by the Fiji
Sugar Corporation (FSC) to carry out an assessment of the quality of
water in the Ba river before crushing season began in June , 1993. Two
staff from the IAS visited the Rarawai mill and collected water samples
from the Ba river in early June, 1993.
The request from the FSC is in response to speculation that the Rarawai
mill in Ba was responsible for the incidence of fish kill and depleting fish
stock in the river. It is intended therefore that the final water quality
assessment will cover the pre-crushing, crushing and post-crushing
periods from June through to late November of 1993. This report
represents the baseline report of the full assessment.
BACKGROUND
The effect of the Rarawai mill effluent on the Ba river has been
investigated once before by the Institute of Natural Resources (now
known as the Institute of Applied Sciences) . The previous study was
based on a single sampling visit, and was carried out in January of 1991.
The results are contained in a report to the National · Environment
Management Programme (NEMP), dated July, 1991.
Briefly, the results of the previous study indicated that the mill effluent
discharged through main drain 1 was not causing any significant pollution
of the Ba river. However, the conclusion drawn from the study has to be
viewed with caution since one visit was not sufficient and secondly,
other significant sources of pollution such as the solid waste (mill mud
and mill ash) were not investigated.
The potential sources of pollution from a sugar mill include waste water
from cane washings, waste water from floor washings and washing of
equipment. Waste water from cane washings would contain much solid
impurities and soil as well as some sugar and may be coloured.
Effluents from the milling process are characterised by high biological
oxygen demand (BOD), high chemical oxygen demand (COD) and a high
concentration of suspended solids . This waste could present the greatest
risk of pollution in the environment if not managed properly.
Another potential source of pollution that is not often investigated is the
solid trash that often accumulates in the mill area. This solid waste
would have a significantly high concentration of nutrients such as nitrates
and phosphates as well as lime . The disposal of such waste must be
managed properly to avoid any leachate reaching the waterways, creeks
and rivers where problems of eutrophication could arise.
1

1.3 Page 3

▲back to top
SAMPLING AND ANALYSIS
Sampling of the Ba river water vvas carried out on June 2nd, 1993, a few
days before crushing of cane began at the Rarawai mill.
Altogether six sites were sampled along the Ba river. Fig. 1 shows the
location of the sampling sites. The sites were seJected in such a way
that they cover as wide an area as possible, incorporating the reference
location (upstream from potential mill impact), the discharge outlet from
the mill, as well as other io, tential sources of pollution along the river
(drainage from town and settlements).
On-site measurements included surface water temperature, pH and
dissolved oxygen (DO). Water samples were collected in specially­
washed bottles for the laboratory analysis work. In the laboratory,
parameters assessed included alkalinity, biological oxygen demand (BOD),
nutrients (nitrates, nitrites, phosphates etc.), suspended and dissolve, d
solids and coliform concentrations. The methods used for laboratory
analysis work were standard methods for analysis of water and waste
waters (APHA, 1989)
SITE LOCATION AND DESCRIPTION
Site 1 -
about 5 km upstream from mill (past Nasolo village), at Irish
Crossing, beyond possible impact of mill effluent, reference
site.
Site 2 -
about 1 OOm downstream from mill discharge outlet.
Site 3 -
at mouth of Elevuka Creek which drains Ba town.
Site 4 -
where creek draining Nailaga village and hospital discharges
into Ba river.
Site 5 -
about 300 upstream from Votua village.
Site 6 -
about 75m downstream from Votua village.
Note
Sites 5 and 6 were selected to cover the critical area of
concern (Votua villaoe).

1.4 Page 4

▲back to top
cig. 1 LOCATION OF SAMPLING STATIONS ALONG THE BA RIVER
~~!i~filf{iii:~J1:;:;t0hii@l~J~~,i~...··•,.0
t\\ SITE
,.
! ,-:/;·-.,\\\\ \\ ~"
.... ·.·, =~,.u..b .
_ _ _ .. _ • - · - • -- • a.L .

1.5 Page 5

▲back to top
RESULTS
Table 1 shows the results for all of the measurements and analysis
carried out on the six water samples.
pH, Temperature
The general physical parameters of pH and temperature were very similar
for the six sites and the values are well within acceptable range for
unpolluted waters.
The pH values were all about neutral (pH 7), and they satisfy required
international standards of pH 6.5 - 9.0 for receiving waters (US EPA,
1976). Temperature was fairly constant for the six sites.
Dissolved oxygen (DO), BOD
The dissolved oxygen values were very similar and they varied from 6.6
to 7.2 mg/I, indicating oxygen saturation of the water at all sites.
Biological oxygen demand values were. also very similar, ranging from 2.6
to 3.6 mg/I. These values indicated very little or no pollution in the river,
according to internationally-recognised criteria (see Discussion below).
The results for dissolved oxygen levels and BOD indicated that organic
pollution was not a problem in the river during the sampling occasion.
Nutrients
Nitrate concentrations varied from 120 to 430 ug/1, the highest
concentration being found at site 3 where the creek draining the town
discharges into the Ba river. Of importance for later visits and
comparison is the fact that _site 2, next to mill effluent discharge site
recorded the lowest concentration of nitrates during this pre-crushing
visit.
Nitrite values varied from 12 to 79 ug/1. Site 4 had the highest value of
79 ug/1 NO2 which was significantly higher than the other values. The
lowest nitrite concentration was recorded for site 1, the reference site.
Ammonia concentrations varied from 19 to 85 ug/1, with sites 4, 5 and 6
recording the highest concentrations. Interestingly at this stage, site 2
near the mill effluent outlet recorded the lowest concentration of 19 ug/1.
Total kjeldhal nitrogen values varied from 0.3 to 1.2 mg/I but sites 5 and
6 near Votua village seemed to· be significantly higher than the other
sites. The results for the nutrients which showed significant site-related
differences are gr_aphed in Fig. 2.
4

1.6 Page 6

▲back to top
Institute of Applied Sciences, USP
Analytical Results for WATER
Client : Fiji Sugar Corporation, Ba
Date received : 3/06/93
Parameter & Unrts
Lab No.
pH
Temperature (°C)
Dissolved oxygen (mg/L)
f\\lkalinrty (mg CaCO'< /L)
Nitrate (ug/L NO,)
Nrtrrte (ug/L NO2)
Ammonia (ug/l NH1 )
Nitrogen, Total N (mg/L)
Phosphate (ug P/L)
Phosphorus, Total (ug P/L)
Total coliforms (/100 ml)
Faecal coliforms (/100 ml)
Total suspended solids (rng/L)
Total dissolved solids (mg/l)
BOD (mg/L)
Field
Blank
<1
<1
Site 1
M93/872
7.6
25.1
6.9
66
150
12
29
0.30
35
60
71,000
540
28
138
3.6
Srte 2
M93/873
7.6
25 .2
7.2
65
120
20
19
0.38
39
48
81,000
630
12
129
3.2
Site 3
M93/874
7.5
25 .5
6.8
70
430
39
21
0.38
19
54
92,000
78,000
10
126
2.8
Site 4
M93/875
7.6
25.4
6.6
66
320
79
85
0.45
48
57
100,000
580
45
2,058
2.8
Site 5
M93/876
7.5 .
25.4
6.7
68
300
44
61
0.90
20
54
na
na
39
3,446
2.6
Srte 6
M93/877
7.6
25.5
6,6
69
390
44
55
1.23
31
48
97,000
640
42
5,940
2.8
TABLE I

1.7 Page 7

▲back to top
Phosphate concentrations varied from 19 to 48 ug/I with no significant
difference between sites. Total phosphorus concentrations also did not
differ much for the six sites, with values ranging from 48 to 60 ug/1.
Suspended and dissolved solids
The results for total dissolved solids and suspended solids showed a
significant increase in concentrations for the sites downstream of the
bridge. The sites upstream of the bridge (sites 1 & 2) showed the lowest
concentrations of solids.
Total suspended solids (TSS) concentrations varied from 10 to 45 mg/I,
with sites 4, 5 and 6 recording the highest values.
Total dissolved solids (TDS) concentrations varied from 126 to 5940
mg/I. Sites 4, 5 and 6 had significantly higher concentrations than the
other sites.
The high solid concentrations in the water at the downstream sites (4, 5
and 6) may be explained by the fact that at the time of sampling,
construction work was being carried out on the bridge. which was
damaged by cyclone Kina early in January. Furthermore, people were
being transported across the river in boats, just upstream from these
sites.
Microbiological assessment
Both total coliform and faecal coliform concentrations were very high for
the five sites sampled. Site 5 was not analysed for coliforms.
Total coliform count varied from 71,000 to 100,000 organisms/100 ml
, water and faecal coliform count varied from 540 to 78,000
organisms/100 ml.
As far as faecal coliform levels is concerned, all sites exceeded the
recommended standard for bathing waters ( < 350 org/100 ml) according
to World Health Organisation (WHO) guidelines (WHO, 1983). The
highest faecal coliform count was recorded for site 3 near the mouth of
the Elevuka creek, indicating that the town was a significant source of
sewage pollution in the river.
Fig. 3 shows the results for coliform counts, BOD and total suspended
solids for the six sites.
6

1.8 Page 8

▲back to top
1400Nutrients Ba River June 1993 ·
100
Before Sugar Crushing Season
1200 --
- - ••-•-•-•••••-•••mmR ,,.,·······················-········•·····•·····•-·-·-··-··••········-·-····--�-·················-·-·............._........ ...................................... (:} .........
-- - - - - 1000
z
f-- 800--· ······································ ··· ·····-··
C"1
0z
:::::::: 600
··· - -······ ··-· -- -
0)
:::,
400
J ---,l
·
•·-·
··
·
·
·-·
·
·
·
·
·
·
··
-·-·
·
·
·
·
·
·
·
·
·-·-·
·
·
·
·
iii!•·
•·
--
•··
80
--
N
Jf
60 0z
C'0
- --~
�f- •: . . . . . ,,,,:;:t••········-··-·-·-·-· 1
zI
.__,
::I 40 rn
½-
~ % 111111111:t,=l---------------=l!r~ i i: ______ _
:::,
200
II 20 ............___ ~~~ :ii.I'• •·· _,,.....
m ::~:::
r!~~
¥
ff
0
=-•--- --=<-..~it JI · _0
Site 1 Site 2 Site 3 Site 4 Site 5 Site 6
j II Nitrate II Nitrite II Ammonia II Kjeldahl NI
Figure 2

1.9 Page 9

▲back to top
Coliforms/80D/TSS Ba River June 1993
Before Sugar Crushing Season
1Es �-----------'-----�-�so
j
1 E4 -. .................... ·
E
0
0
enT"""
1000
+J
·C
:J
.,,
0
0
',.•,l',
100
--1-
·11
10 - :ii'
,
I
·· ... - . ·
,mm,,-. ..
..
....
·-·"
I
i:!,_ I��m,l.,!·:1,.1
.
:.
__1·,,,:_
1
I
mi
.,:_Il',_
r
t,it,,i·,i,....
i�
•.i,i,·,
11I(;m-l1F• ,
I
1: - · .... -·-.. ·····....7:Ji ... . ··-..··-···-j ......
ffr1. .• -·-·
i,
40
,,__
ll ❖•
m
··-····•,.•,•.,:'.• ···· ? .
\\•: ...................... ................
I.::: . ·I:s..«
_,,,,.. ......
30
o0
"l @
•.:!l:.• ,I,.i :,.•:.1,•.·
@•r
l,�., - 1 - 20 �
•: .:,,•, .,1•. ,•,
�·......
.
! ' i - if." :i.i1.
l•I , � !.1, :,, !_,l;:,.t I
..,.•,1.•,.:,1.
1
I
10 E
1
11111 ,·'•..,
.
0
Site 1 Site 2 Site 3 Site 4 Site 5 Site 6
[IITC •Fe IIBODIITSS
Figure 3
8

1.10 Page 10

▲back to top
DISCUSSION OF RESULTS
The results obtained from this visit represent the situation in the absence
of any impact from the sugar mill discharge, since crushing had not
commenced and no effluent sample was collected or analysed.
The parameters which did not vary much for the six sites included pH,
temperature, dissolved oxygen, BOD, alkalinity, total nitrogen, phosphate
and total phosphorus concentrations. The values obtained also satisfied
recommended levels for unpolluted waters (see Table 2 below). These
parameters were unaffected by site location and site variations.
However, certain parameters were showing significant variation,
depending on the location of the sites. These parameters could be
important indicators for water quality and water pollution in the absence
of any impact from the sugar mill or when the mill is not operating. These
parameters were ammonia, nitrites, faecal colifarm and total dissolved
solids and total suspended solids.
In the case of ammonia, the increase in concentration is about 3 to 4
times those of sites 1, 2 and 3, but the values were still within
acceptable range for receiving waters as specified by the Canadian Water
Quality Guidelines ( < 730 ug/I).
Site 4 with the highest concentration of ammonia indicated that the creek
draining Nailaga town, hospital and close environs was discharging much
of this compound into the river. An important factor that would need to
be investigated further is the impact of agricultural land use practices,
particularly the use of fertilizers and pesticides on the creeks and rivers in
the Nailaga area, seeing that ammonia concentrations were significantly
higher at sites 4, 5 and 6 than further upstream.
For nitrite concentrations, again site 4 had the highest concentration, the
increase being almost 100% that of site 3. The value for site 4 was the
only one that did not satisfy recommended limits which is < 60 ug/I,
according to the Canadian Guidelines. As in the case of ammonia, this
observation would again indicate that the Nailaga area was an important
source of nitrite in the Ba river.
In the case of faecal coliform concentrations, none of the sites satisfied
recommended standards for faecal coliform counts for bathing waters
which is < 350 organisms/100 ml water (WHO, 1983). This indicated
that sewage pollution in the river is quite widespread and significant.
Perhaps the most significant increases were those of the solids in the
water as recorded for sites 4, 5 and 6. The increases for these sites over
sites 1, 2 and 3 are more than 100%, exceeding recommended standards

2 Pages 11-20

▲back to top

2.1 Page 11

▲back to top
as specified by both the Canadian Guidelines and the United States
Environmental Protection Agency (USEPA, 1976). As mentioned above,
an important source of these materials in the water was the construction
work being carried out on the damaged Ba bridge and the increased
boating activity in the area. As well as this, the creeks draining Nailaga
area and environs could be important sources of suspended and dissolved
solids.
Table 2 : Some Recommended Criteria for Receiving Water
Parameter
pH
Dissolved oxygen
BOD
Nitrate
Nitrite
Ammonia
Total nitrogen
Phosphate
Total phosphorus
Suspended solids
Criteria
6.5 - 9
> 6 mg/I
< 5 mg/I
< 10 mg/I
< 60 ug/I
< 730 ug/I
No specific limit
Up to 70 ug/I
< 50 ug/I
Increased over
background by not
more than 10%
Source
CCR (1987)1
CCR (1987)
Clark (1986)
USEPA (1976) 2
CCR (1987)
CCR (1987)
(Coral reef growth)3
(Wetzel, 1975)
CCR (1987)
1. Canadian Council of Resources, 1987. Canadian Water Quality
Guidelines.
2. United States Environmental Protection Agency, 1986. Quality
Criteria for Water.
3. Blake and Johnson, 1988.
CONCLUSIONS
From the results and discussion presented above, the following
conclusions are drawn
1. The chemical water quality in the Ba river during the sampling visit
was generally good,
2. there was no evidence of significant organic pollution as indicated
by the DO and BOD values,

2.2 Page 12

▲back to top
3. Microbiological (sewage) pollution was found to be quite
widespread and of concern.
RECOMMENDATIONS
No recommendations can be made at this stage until sampling is
undertaken during the crushing s�ason.
REFERENCES
APHA-AWWA-WPCF. 1989. Standard Methods for the Examination of
Water and Wastewater. Amer. Pub. Health Assoc., 17th Ed.
Blake, S.G. and Johnson, D.P. 1988. Preliminary report on water quality,
current patterns and sediment composition around Hamilton and
Hayman Islands, the Whitsundays. Report to the Great Barrier Reef
Marine Park Authority (GBRMPA), Department of Geology, James
. Cook University, Townsville.
Clark, R.B. 1986. Marine Pollution. Clarendon Press, Oxford, 215p.
INR, 1991. Effect of Rarawai mill effluent discharge on the Ba river.
Report to the National Environment Management Programme
(NEMP).
USEPA, 1976. Quality Criteria for Water. United States Environmental
Protection Agency, Washington, D.C., 501p.
Wetzel, R.G. 1975. Limnology.
Philadelphia, 743p.
Saunders College Publishing,
WHO, 1983. Compendium of Environmental Guidelines and Standards
for Industrial Discharges. WHO, Geneva.